


在 Kubernetes 中运行大规模以 Web 为中心的工作负载,最关键的需求之一就是在 L7 层实现高效流畅的入口流量管理。自从第一批 Kubernetes Ingress Controller 开发完成以来,Envoy(由 Matt Klein 和 Lyft 团队开发)已经成为云原生生态系统中的新生力量。Envoy 之所以受到支持,因为它是一个 CNCF 托管的项目,与整个容器圈和云原生架构有着天然的支持。
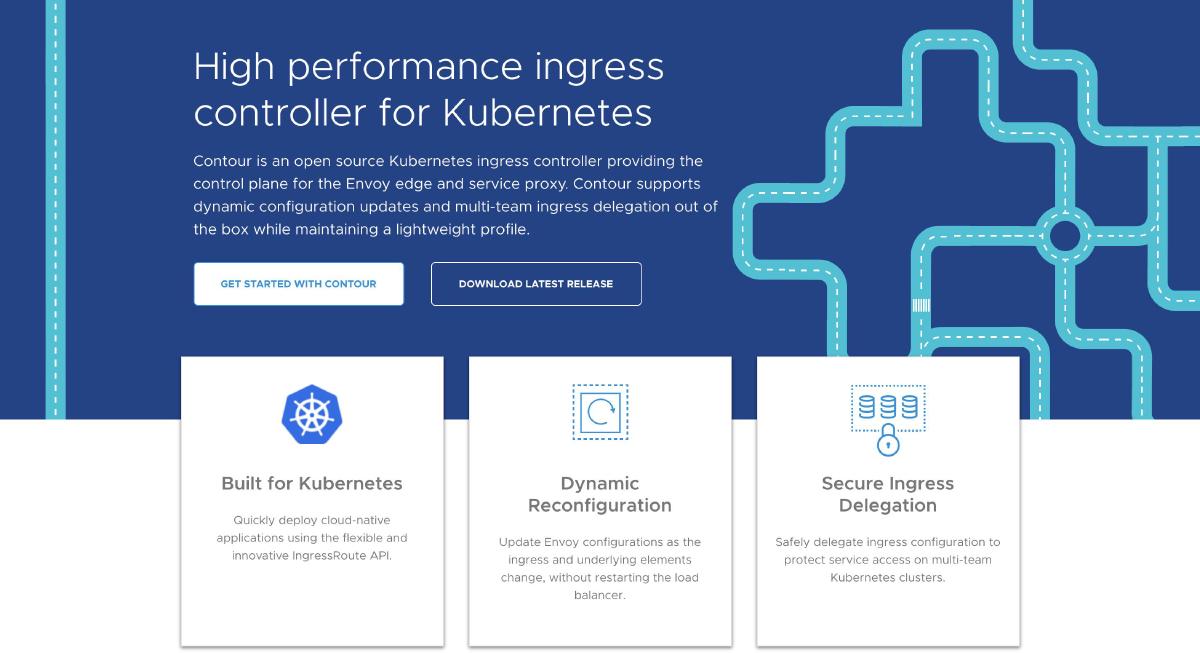
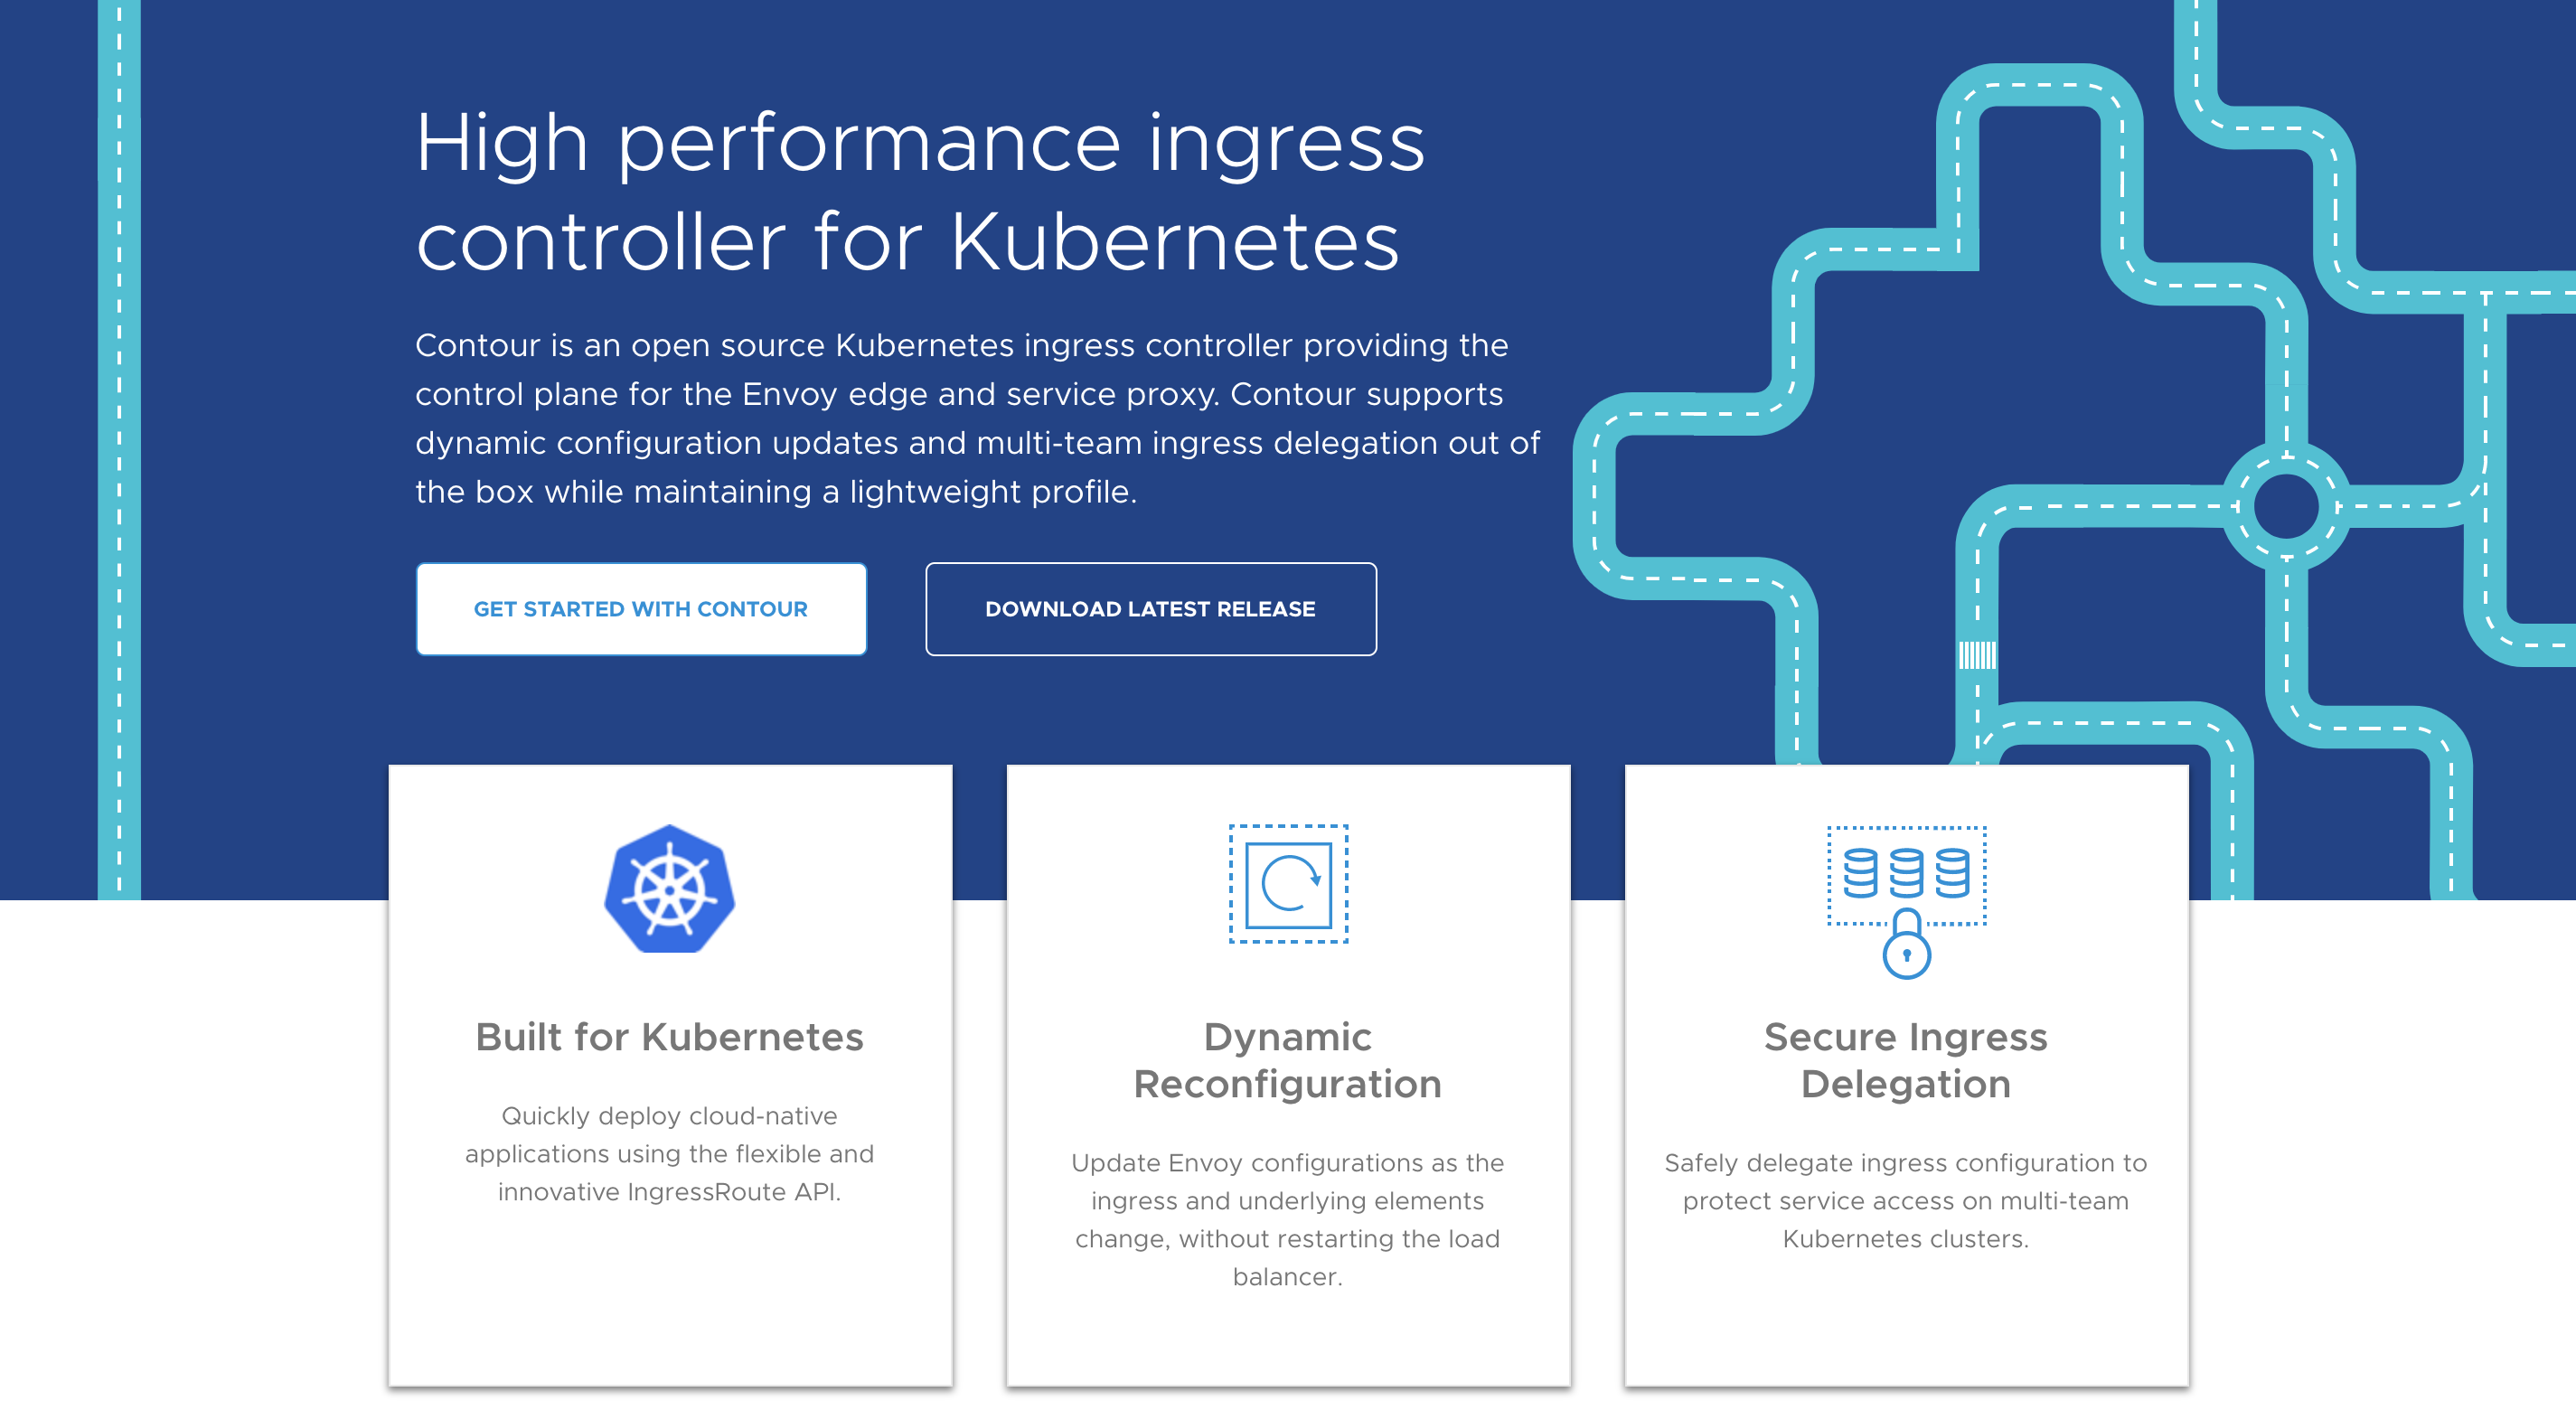
容器公司 Heptio 开源的项目 Contour 使用 Envoy 作为 Kubernetes 的 Ingress Controller 实现,为大家提供了一条新的 Kubernetes 外部负载均衡实现思路。
据官方博客介绍,Heptio Contour 可以为用户提供以下好处:
- 一种简单的安装机制来快速部署和集成 Envoy。
- 与 Kubernetes 对象模型的集成。
Ingress配置的动态更新,而无需重启底层负载均衡器。- 项目成熟后,将允许使用 Envoy 一些强大的功能,如熔断器、插件式的处理器链,以及可观测性和可调试性,可以非常方便地对接监控系统。
- IngressRoute 之间可以级联,用来做蓝绿部署非常方便。
下面我们就来试用一下。
安装步骤#
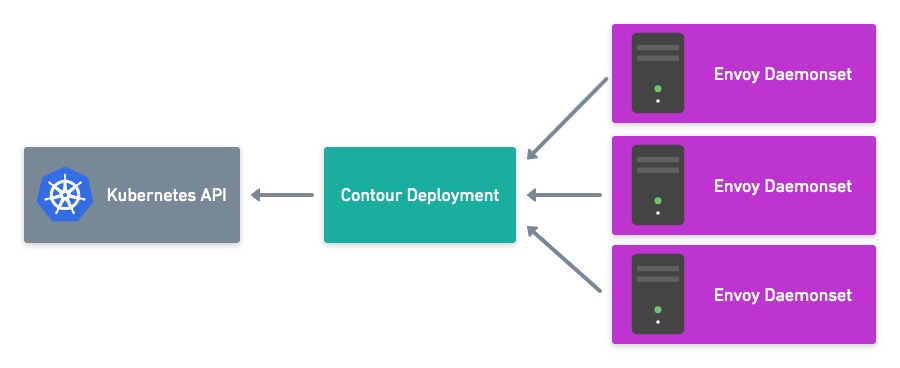
Contour Ingress controller 由两个组件组成:
Envoy: 提供高性能反向代理。Contour: 充当 Envoy 的控制平面,为 Envoy 的路由配置提供统一的来源。
官方文档提供了三种部署方法:
- 通过
DaemonSet来部署,每个节点上跑一个 Contour 实例(Contour 与 Envoy 在同一个 Pod 中)。 - 通过
Deployment来部署,总共跑两个 Contour 实例(Contour 与 Envoy 在同一个 Pod 中)。 - 通过 Deployment 来部署 Contour,总共跑两个 Contour 实例;通过 DaemonSet 来部署 Envoy,每个节点上跑一个 Envoy 实例。
经过老夫目测,第三种方案比较妙,这样可以让 Contour 和 Envoy 这两个组件解耦,可以分别按需对不同的组件进行扩展,具体的优势如下:
- Envoy 以 Daemonset 的形式运行,具有很强的扩展性,后续可通过
ipvs和keepalived等工具来实现其负载均衡和高可用。 - Envoy 运行的网络模式是
hostNetwork,减少了额外的网络性能损耗。 - Contour 与 Envoy 之间通过双向认证的自签名证书进行通信,大大增强了安全性。
- 升级 Contour 不需要重启 Envoy。
听起来好像不错的样子。

我们就采用第三种方案来部署,首先克隆官方仓库,进入 manifest 清单目录:
$ git clone https://github.com/heptio/contour
$ cd contour/examples/ds-hostnet-split
为了便于查看 envoy 的配置,修改 03-envoy.yaml,将 envoy 的 admin-adress 设置为 0.0.0.0,并暴露 9001 端口:
...省略...
initContainers:
- args:
  - bootstrap
  - --admin-address=0.0.0.0
  - /config/contour.json
...省略...
将 Envoy Service 的类型改为 ClusterIP,并删除 annotation:
$ cat 02-service-envoy.yaml
apiVersion: v1
kind: Service
metadata:
 name: envoy
 namespace: heptio-contour
spec:
 ports:
 - port: 80
   name: http
   protocol: TCP
 - port: 443
   name: https
   protocol: TCP
 selector:
   app: envoy
 type: ClusterIP
部署:
$ kubectl apply ./
查看状态:
$ kubectl -n heptio-contour get pod
NAME                       READY   STATUS      RESTARTS   AGE
contour-767fd99989-27qjw   0/1     Running     0          21s
contour-767fd99989-kcjxz   0/1     Running     0          21s
contour-certgen-29nqs      0/1     Completed   0          21s
envoy-cnzvm                0/1     Running     0          21s
envoy-lb8mm                0/1     Running     0          21s
envoy-qzmt4                0/1     Running     0          21s

$ kubectl -n heptio-contour get job
NAME              COMPLETIONS   DURATION   AGE
contour-certgen   1/1           2s         4m42s
contour-certgen 是一个 Job,它会生成有效期为一年的 mTLS(双向认证)证书,并将其挂载到 Contour 和 Envoy 的容器中。如果你想自定义证书,可以参考官方文档。
如果你还没有部署 Kubernetes 集群怎么办?废话,当然是用 sealos 啊!分分钟搞起一个高可用集群。
Ingress 测试#
安装结束后,我们就可以来测试 Ingress 了。在 examples/example-workload 目录下包含一个示例应用,可以直接使用:
$ kubectl apply -f examples/example-workload/kuard-ingressroute.yaml
查看创建好的资源:
$ kubectl get po,svc,ingressroute -l app=kuard
NAME                         READY   STATUS    RESTARTS   AGE
pod/kuard-67789b8754-5c4w7   1/1     Running   0          63s
pod/kuard-67789b8754-fpdfb   1/1     Running   0          63s
pod/kuard-67789b8754-fx9bn   1/1     Running   0          63s

NAME            TYPE        CLUSTER-IP    EXTERNAL-IP   PORT(S)   AGE
service/kuard   ClusterIP   10.97.46.79   <none>        80/TCP    63s

NAME                                    FQDN          TLS SECRET   FIRST ROUTE   STATUS   STATUS DESCRIPTION
ingressroute.contour.heptio.com/kuard   kuard.local                /             valid    valid IngressRoute
将域名加入本地电脑的 hosts:
$ echo "$INGRESS_HOST kuard.local" >> /etc/hosts
其中 $INGRESS_HOST 是任意运行 Envoy 节点的 IP。
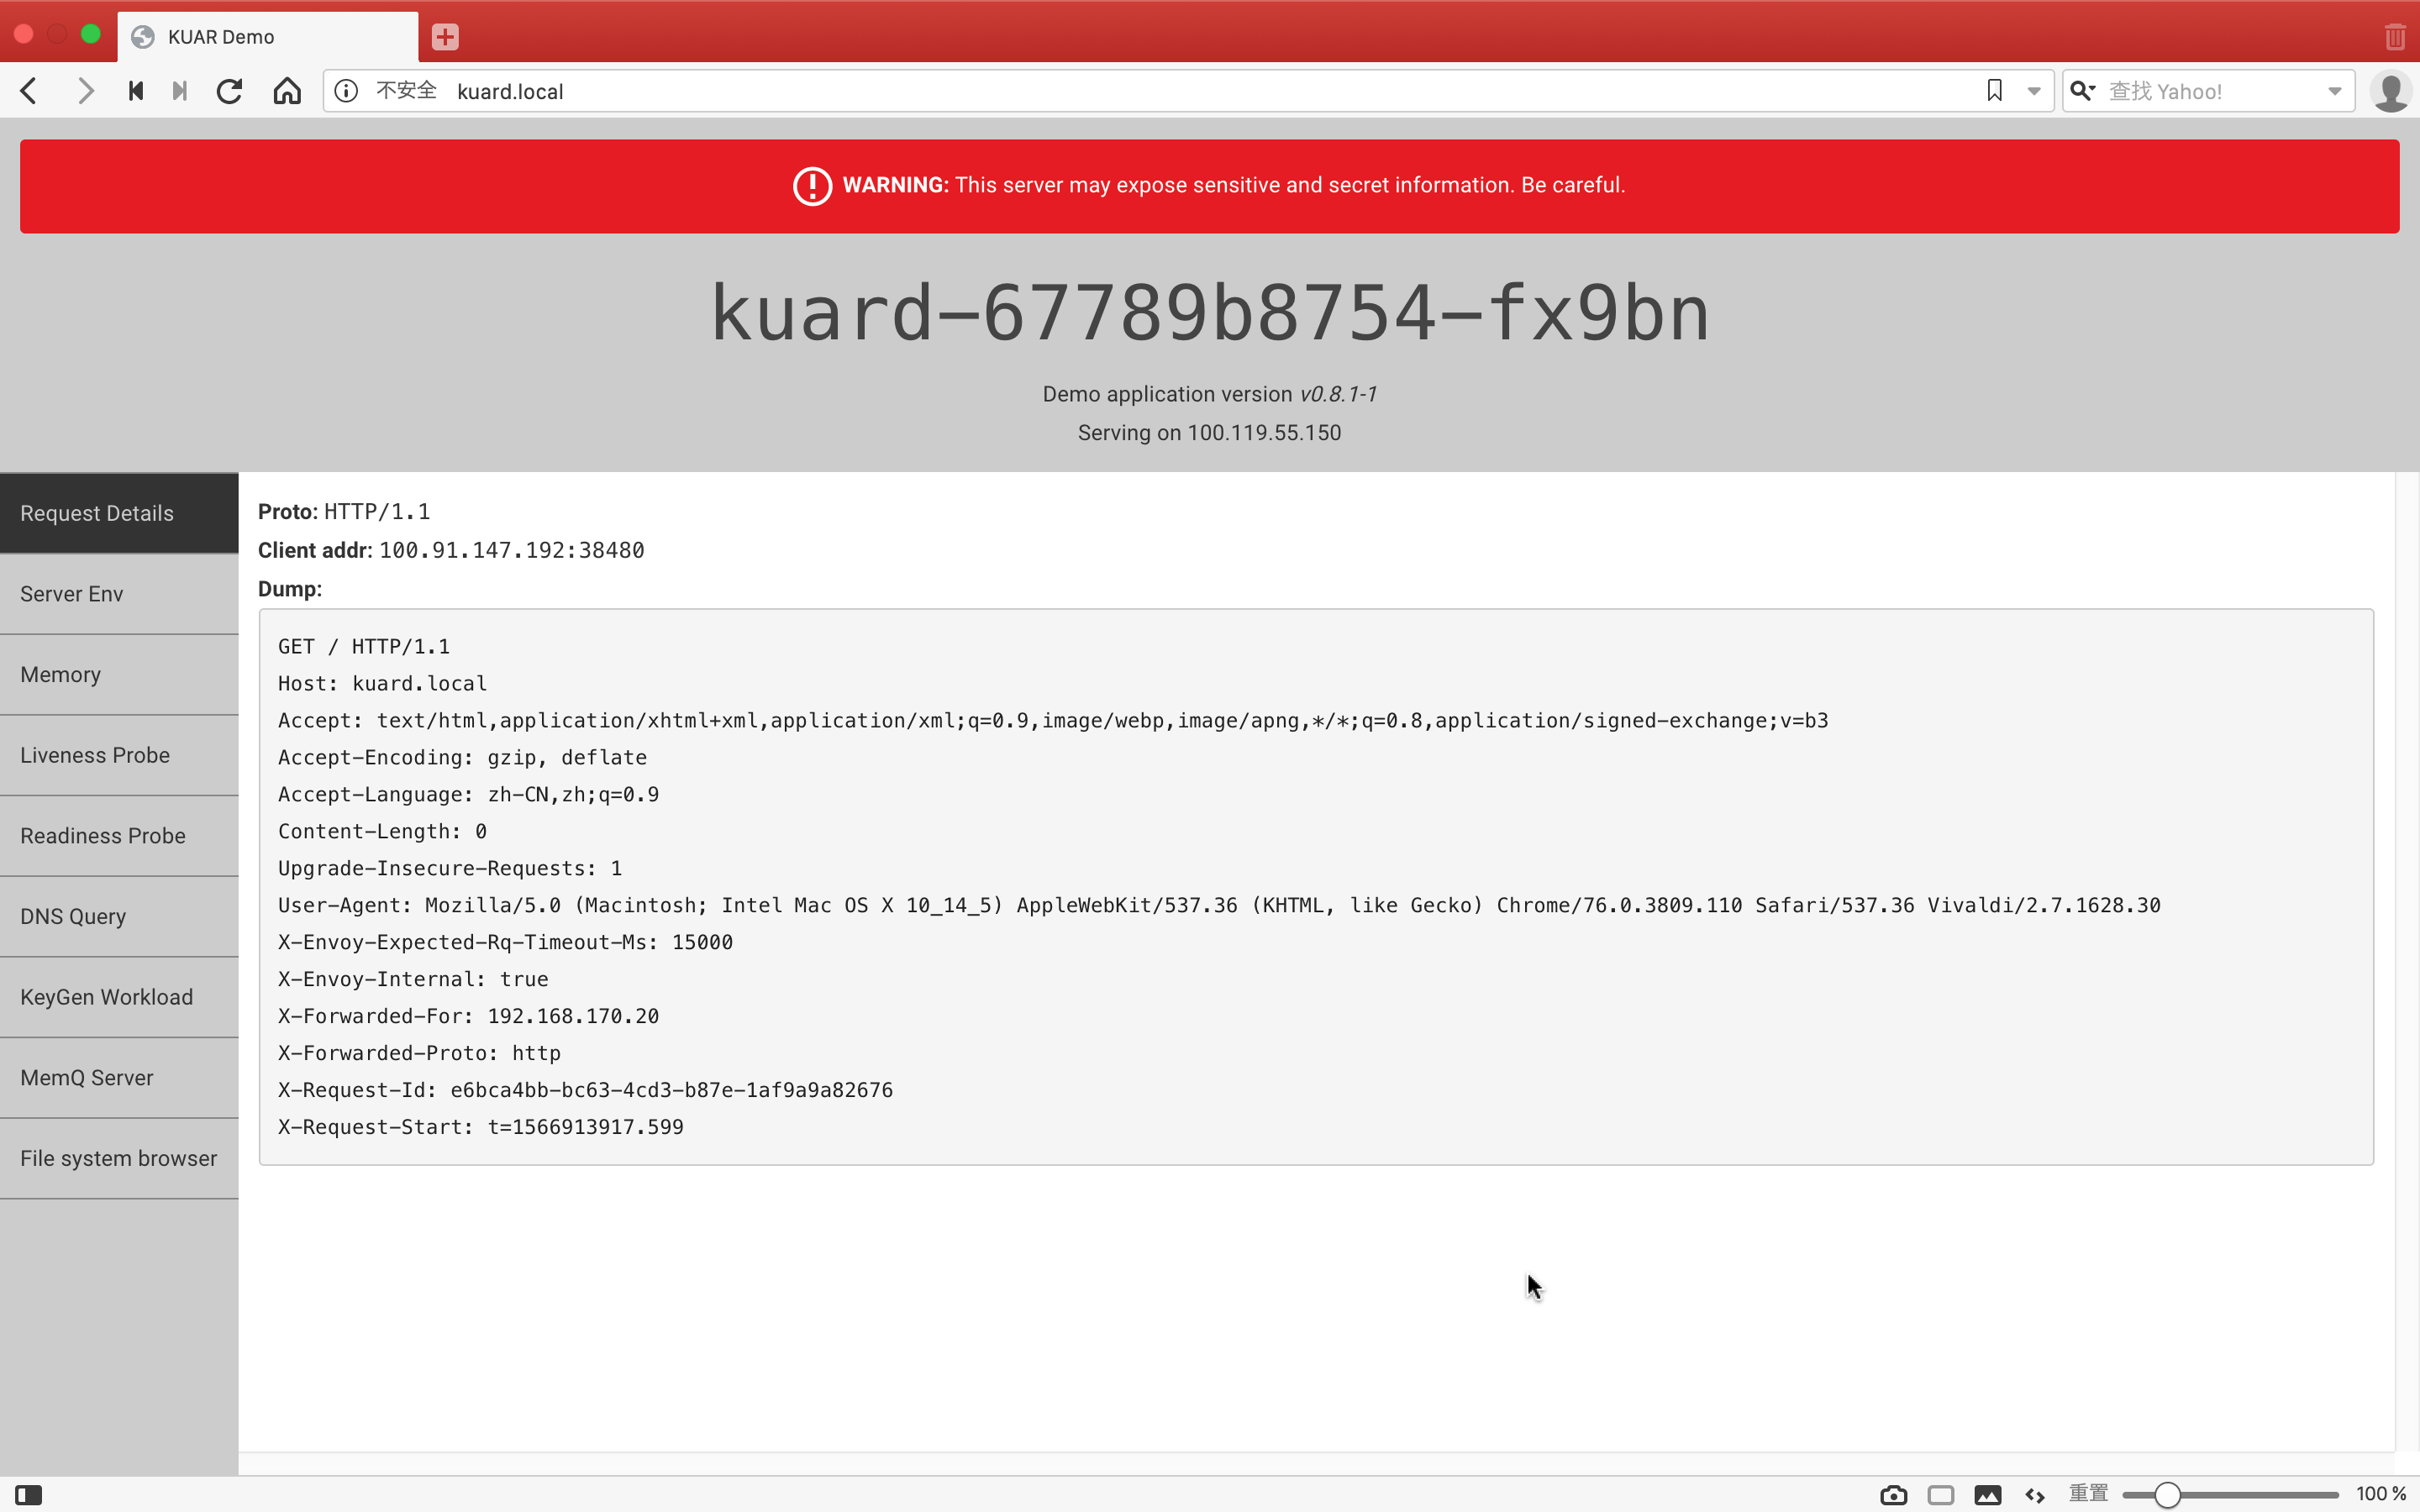
现在我们就可以在浏览器中输入域名 kuard.local 访问应用了:
Contour 工作原理#
Contour 同时支持 Ingress 资源对象和 IngressRoute 资源对象(通过 CRD 创建),这些对象都是为进入集群的请求提供路由规则的集合。这两个对象的结构和实现方式有所不同,但它们的核心意图是相同的,都是为进入集群的请求提供路由规则。如不作特殊说明,后面当我们描述 “Ingress” 时,它将同时适用于 Ingress 和 IngressRoute 对象。
通常情况下,当 Envoy 配置了 CDS 的 endpoint 时,它会定期轮询端点,然后将返回的 JSON 片段合并到其运行配置中。如果返回到 Envoy 的集群配置代表当前的 Ingress 对象的集合,则可以将 Contour 视为从 Ingress 对象到 Envoy 集群配置的转换器。随着 Ingress 对象的添加和删除,Envoy 会动态添加并删除相关配置,而无需不断重新加载配置。
在实践中,将 Ingress 对象转换为 Envoy 配置更加微妙,需要将 Envoy 中的 xDS 配置(包括 CDS,EDS 和 RDS)映射到 Kubernetes 中。Contour 至少需要观察 Ingress、Service 和 Endpoint 这几个资源对象以构建这些服务的响应,它通过 client-go 的 cache/informer 机制免费获得这些 watchers。这些 watchers 提供添加,更新和删除对象的边缘触发通知,也可以通过 watch API 在本地缓存缓存对象,以便后续查询。
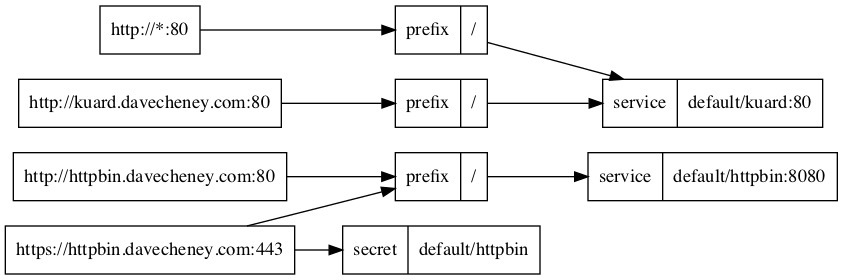
Contour 将收集到的这些对象处理为虚拟主机及其路由规则的有向非循环图(DAG),这表明 Contour 将有权构建路由规则的顶级视图,并将群集中的相应服务和TLS秘钥连接在一起。一旦构建了这个新的数据结构,我们就可以轻松实现 IngressRoute 对象的验证,授权和分发。改数据结构导出的 png 图片如下图所示:
Envoy API 调用和 Kubernetes API 资源之间的映射关系如下:
CDS : 集群发现服务。映射为 Kubernetes 中的
Service以及一部分 Ingress 对象的TLS配置。EDS : 服务发现服务。映射为 Kubernetes 中的
Endpoint。Envoy 使用 EDS 自动获取Cluster成员,这与 Endpoint 对象中包含的信息非常匹配。Envoy 使用 Contour 在EDS响应中返回的名称查询EDS。RDS : 路由发现服务。映射为 Kubernetes 中的
Ingress。提供了虚拟主机名和前缀路由信息的 RDS 与 Ingress 匹配得更好。
映射关系详情#
CDS#
CDS 更像是 Kubernetes 中的 Service 资源,因为 Service 是具体 Endpoint(Pods)的抽象,Envoy Cluster 是指 Envoy 连接到的一组逻辑上相似的上游主机(参考下文的 RDS)。其中 TLS 配置也是 CDS 的一部分,而 Kubernetes 中的 TLS 信息由 Ingress 提供,所以这部分之间的映射关系会有些复杂。
EDS#
EDS 更像是 Kubernetes 中的 Endpoint 资源,这部分映射关系的实现最简单。Contour 将 Endpoint 的响应对象转换为 EDS 的 { address: [] } json 配置块。
RDS#
RDS 更像是 Kubernetes 中的 Ingress 资源。RDS 将前缀,路径或正则表达式之一路由到 Envoy 群集。Envoy 集群的名称可以从 Ingress 的 IngressSpec 的配置项中获取(比如:namespace/serviceName_servicePort),因为这是一个选择器,它会匹配 Service 对象被转换后返回的 CDS 对象。
Contour 架构分析#
Contour Ingress controller 由两个组件组成:
Envoy: 提供高性能反向代理。Contour: 充当 Envoy 的控制平面,为 Envoy 的路由配置提供统一的来源。
以本文的部署方式为例,在 Envoy 的 Pod 初始化期间,Contour 作为 Init 容器运行,并将 bootstrap(初始化)配置写入一个 temporary volume。该 Volume 被传递给 Envoy 容器并告诉 Envoy 将另一个 Deployment 中的 Contour 容器视为控制平面。
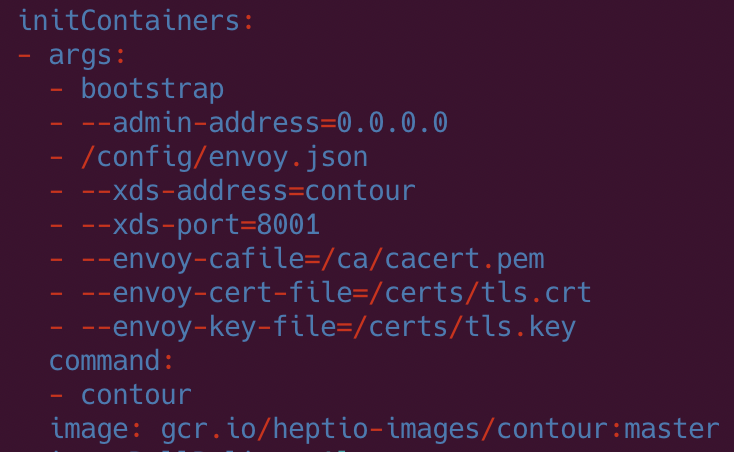
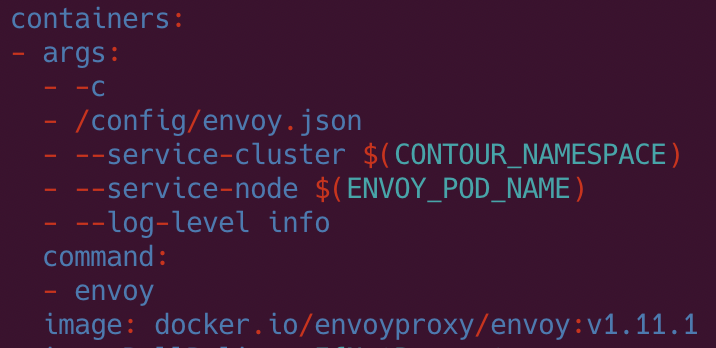
初始化完成后,Envoy 容器启动,检索 Contour 写入的 bootstrap 配置,并开始轮询 Contour 以热更新配置。如果控制平面无法访问,Envoy 将会进行优雅重试。
Contour 相当于 Kubernetes API 的客户端。它监视 Ingress,Service 和 Endpoint 对象,并通过将其对象缓存转换为相关的 JSON 字段来充当其 Envoy 的控制平面。
从 Kubernetes 到 Contour 的信息转换是通过 SharedInformer 框架 watching API 来完成的;而从 Contour 到 Envoy 的信息转换是通过 Envoy 定期轮询来实现的。
IngressRoute 介绍#
Ingress 对象从 Kubernetes 1.1 版本开始被引进,用来描述进入集群的请求的 HTTP 路由规则。但迄今为止 Ingress 对象还停留在 beta 阶段,不同的 Ingress Controller 插件为了添加 HTTP 路由的额外属性,只能通过添加大量的 annotation 来实现,而且每个插件的 annotation 都不一样,非常混乱。
IngressRoute CRD 的目标就是扩展 Ingress API 的功能,以便提供更丰富的用户体验以及解决原始设计中的缺点。
**目前 Contour 是唯一支持 IngressRoute CRD 的 Kubernetes Ingress Controller。**下面就来看看它与 Ingress 相比的优点:
- 安全地支持多团队 Kubernetes 集群,能够限制哪些命名空间可以配置虚拟主机和 TLS 凭据。
- 允许将路径或域名的路由配置分发给另一个命名空间。
- 接受单个路由中的多个服务,并对它们之间的流量进行负载均衡。
- 无需通过添加
annotation就可以定义服务权重和负载均衡策略。 - 在创建时验证 IngressRoute 对象,并在创建后报告验证是否有效。
从 Ingress 到 IngressRoute#
一个基本的 Ingress 对象如下所示:
# ingress.yaml
apiVersion: extensions/v1beta1
kind: Ingress
metadata:
  name: basic
spec:
  rules:
  - host: foo-basic.bar.com
    http:
      paths:
      - backend:
          serviceName: s1
          servicePort: 80
这个 Ingress 对象名为 basic,它将传入的 HTTP 流量路由到头文件中 Host: 字段值为 foo-basic.bar.com 且端口为 80 的 s1 服务。该路由规则通过 IngressRoute 来实现如下:
# ingressroute.yaml
apiVersion: contour.heptio.com/v1beta1
kind: IngressRoute
metadata:
  name: basic
spec:
  virtualhost:
    fqdn: foo-basic.bar.com
  routes:
    - match: /
      services:
        - name: s1
          port: 80
对应关系很简单,我就不再详细介绍了,更多功能配置可以参考官方仓库的文档:IngressRoute。
Envoy 初始配置文件#
Contour 会根据启动参数和 K8S API Server 中的配置信息生成 Envoy 的初始配置文件,可以使用下面的命令将 Envoy Pod 中的配置文件导出来查看其中的内容:
$ kubectl -n heptio-contour exec envoy-lb8mm -- cat /config/envoy.json > envoy.json
打开网站 https://www.bejson.com/jsonviewernew/,将配置文件内容复制粘贴进去,可以看到配置文件的结构如图所示:
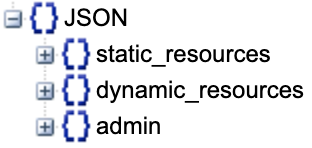
其中各个配置节点的内容如下:
Dynamic_resources#
配置动态资源,这里配置了 LDS 和 RDS 服务器。
"dynamic_resources": {
  "lds_config": {
    "api_config_source": {
      "api_type": "GRPC",
      "grpc_services": [
        {
          "envoy_grpc": {
            "cluster_name": "contour"
          }
        }
      ]
    }
  },
  "cds_config": {
    "api_config_source": {
      "api_type": "GRPC",
      "grpc_services": [
        {
          "envoy_grpc": {
            "cluster_name": "contour"
          }
        }
      ]
    }
  }
}
Static_resources#
配置静态资源,包括了 contour 和 service-stats 两个 cluster,其中 contour cluster 对应前面 dynamic_resources 中的 LDS 和 RDS 配置,指明了 Envoy 用于获取动态资源的服务器地址。
"static_resources": {
  "clusters": [
    {
      "name": "contour",
      "alt_stat_name": "heptio-contour_contour_8001",
      "type": "STRICT_DNS",
      "connect_timeout": "5s",
      "load_assignment": {
        "cluster_name": "contour",
        "endpoints": [
          {
            "lb_endpoints": [
              {
                "endpoint": {
                  "address": {
                    "socket_address": {
                      "address": "contour",
                      "port_value": 8001
                    }
                  }
                }
              }
            ]
          }
        ]
      },
      "circuit_breakers": {
        "thresholds": [
          {
            "priority": "HIGH",
            "max_connections": 100000,
            "max_pending_requests": 100000,
            "max_requests": 60000000,
            "max_retries": 50
          },
          {
            "max_connections": 100000,
            "max_pending_requests": 100000,
            "max_requests": 60000000,
            "max_retries": 50
          }
        ]
      },
      "tls_context": {
        "common_tls_context": {
          "tls_certificates": [
            {
              "certificate_chain": {
                "filename": "/certs/tls.crt"
              },
              "private_key": {
                "filename": "/certs/tls.key"
              }
            }
          ],
          "validation_context": {
            "trusted_ca": {
              "filename": "/ca/cacert.pem"
            },
            "verify_subject_alt_name": [
              "contour"
            ]
          }
        }
      },
      "http2_protocol_options": {}
    },
    {
      "name": "service-stats",
      "alt_stat_name": "heptio-contour_service-stats_9001",
      "type": "LOGICAL_DNS",
      "connect_timeout": "0.250s",
      "load_assignment": {
        "cluster_name": "service-stats",
        "endpoints": [
          {
            "lb_endpoints": [
              {
                "endpoint": {
                  "address": {
                    "socket_address": {
                      "address": "0.0.0.0",
                      "port_value": 9001
                    }
                  }
                }
              }
            ]
          }
        ]
      }
    }
  ]
}
Admin#
配置 Envoy 的日志路径以及管理端口。
"admin": {
  "access_log_path": "/dev/null",
  "address": {
    "socket_address": {
      "address": "0.0.0.0",
      "port_value": 9001
    }
  }
}
结合 Envoy 的初始化配置文件和第 5 节的分析,我们可以大致看到 Contour 通过 Envoy 来实现南北流量管理的基本原理。即控制平面将 xDS server 信息通过 static resource 的方式配置到 Envoy 的初始化配置文件中,Envoy 启动后通过 xDS server 获取到 dynamic resource,包括集群中的 service 信息及路由规则。
Envoy 配置初始化流程:

- Envoy initContainer 根据启动参数和 K8S API Server 中的配置信息生成 Envoy 的初始配置文件
envoy.json,该文件告诉 Envoy 从xDS server中获取动态配置信息,并配置了 xDS server 的地址信息,即控制平面的Contour。 - Envoy 使用配置文件
envoy.json启动。 - Envoy 根据获取到的动态配置启动 Listener,并根据 Listener 的配置,结合 Route 和 Cluster 对进入的流量进行处理。
IngressRoute 配置映射#
通过上节的分析我们知道,Envoy 中实际生效的配置是由初始化配置文件中的静态配置和从 Contour 获取的动态配置一起组成的,我们可以通过 Envoy 的管理接口来获取 Envoy 的完整配置,先打开 Envoy 的管理接口:
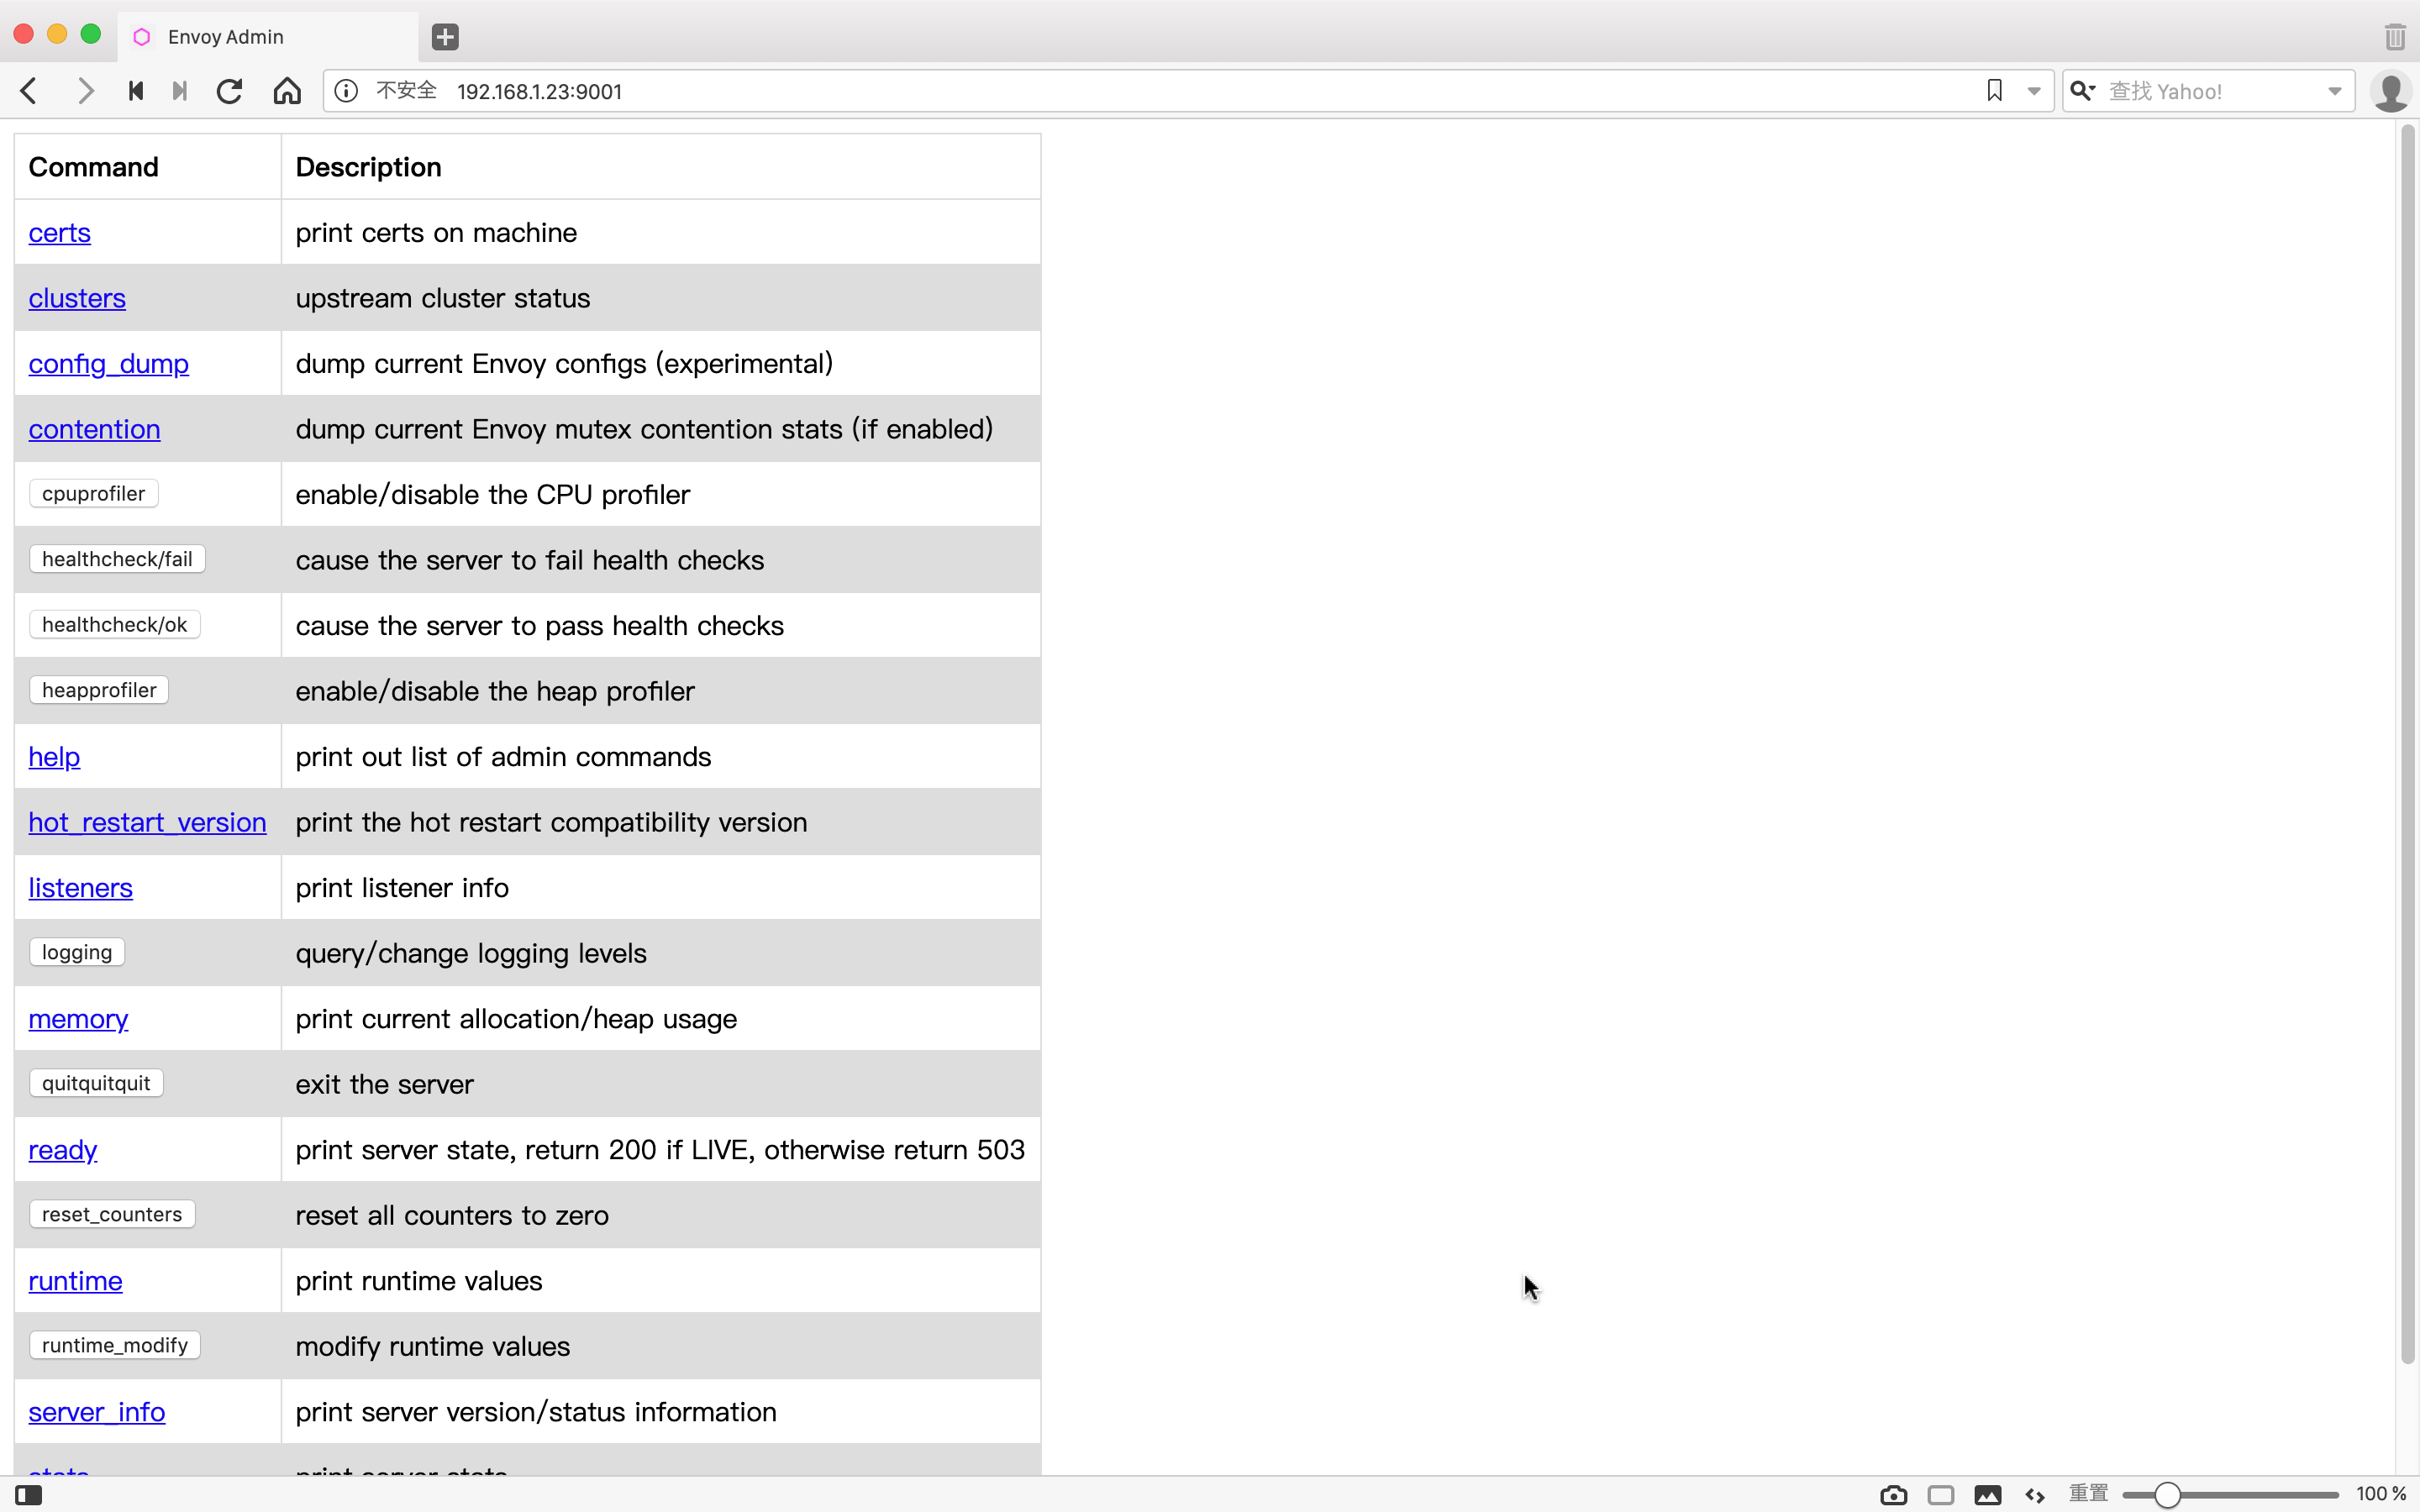
然后点击 config_dump,就能看到 Envoy 的完整配置:
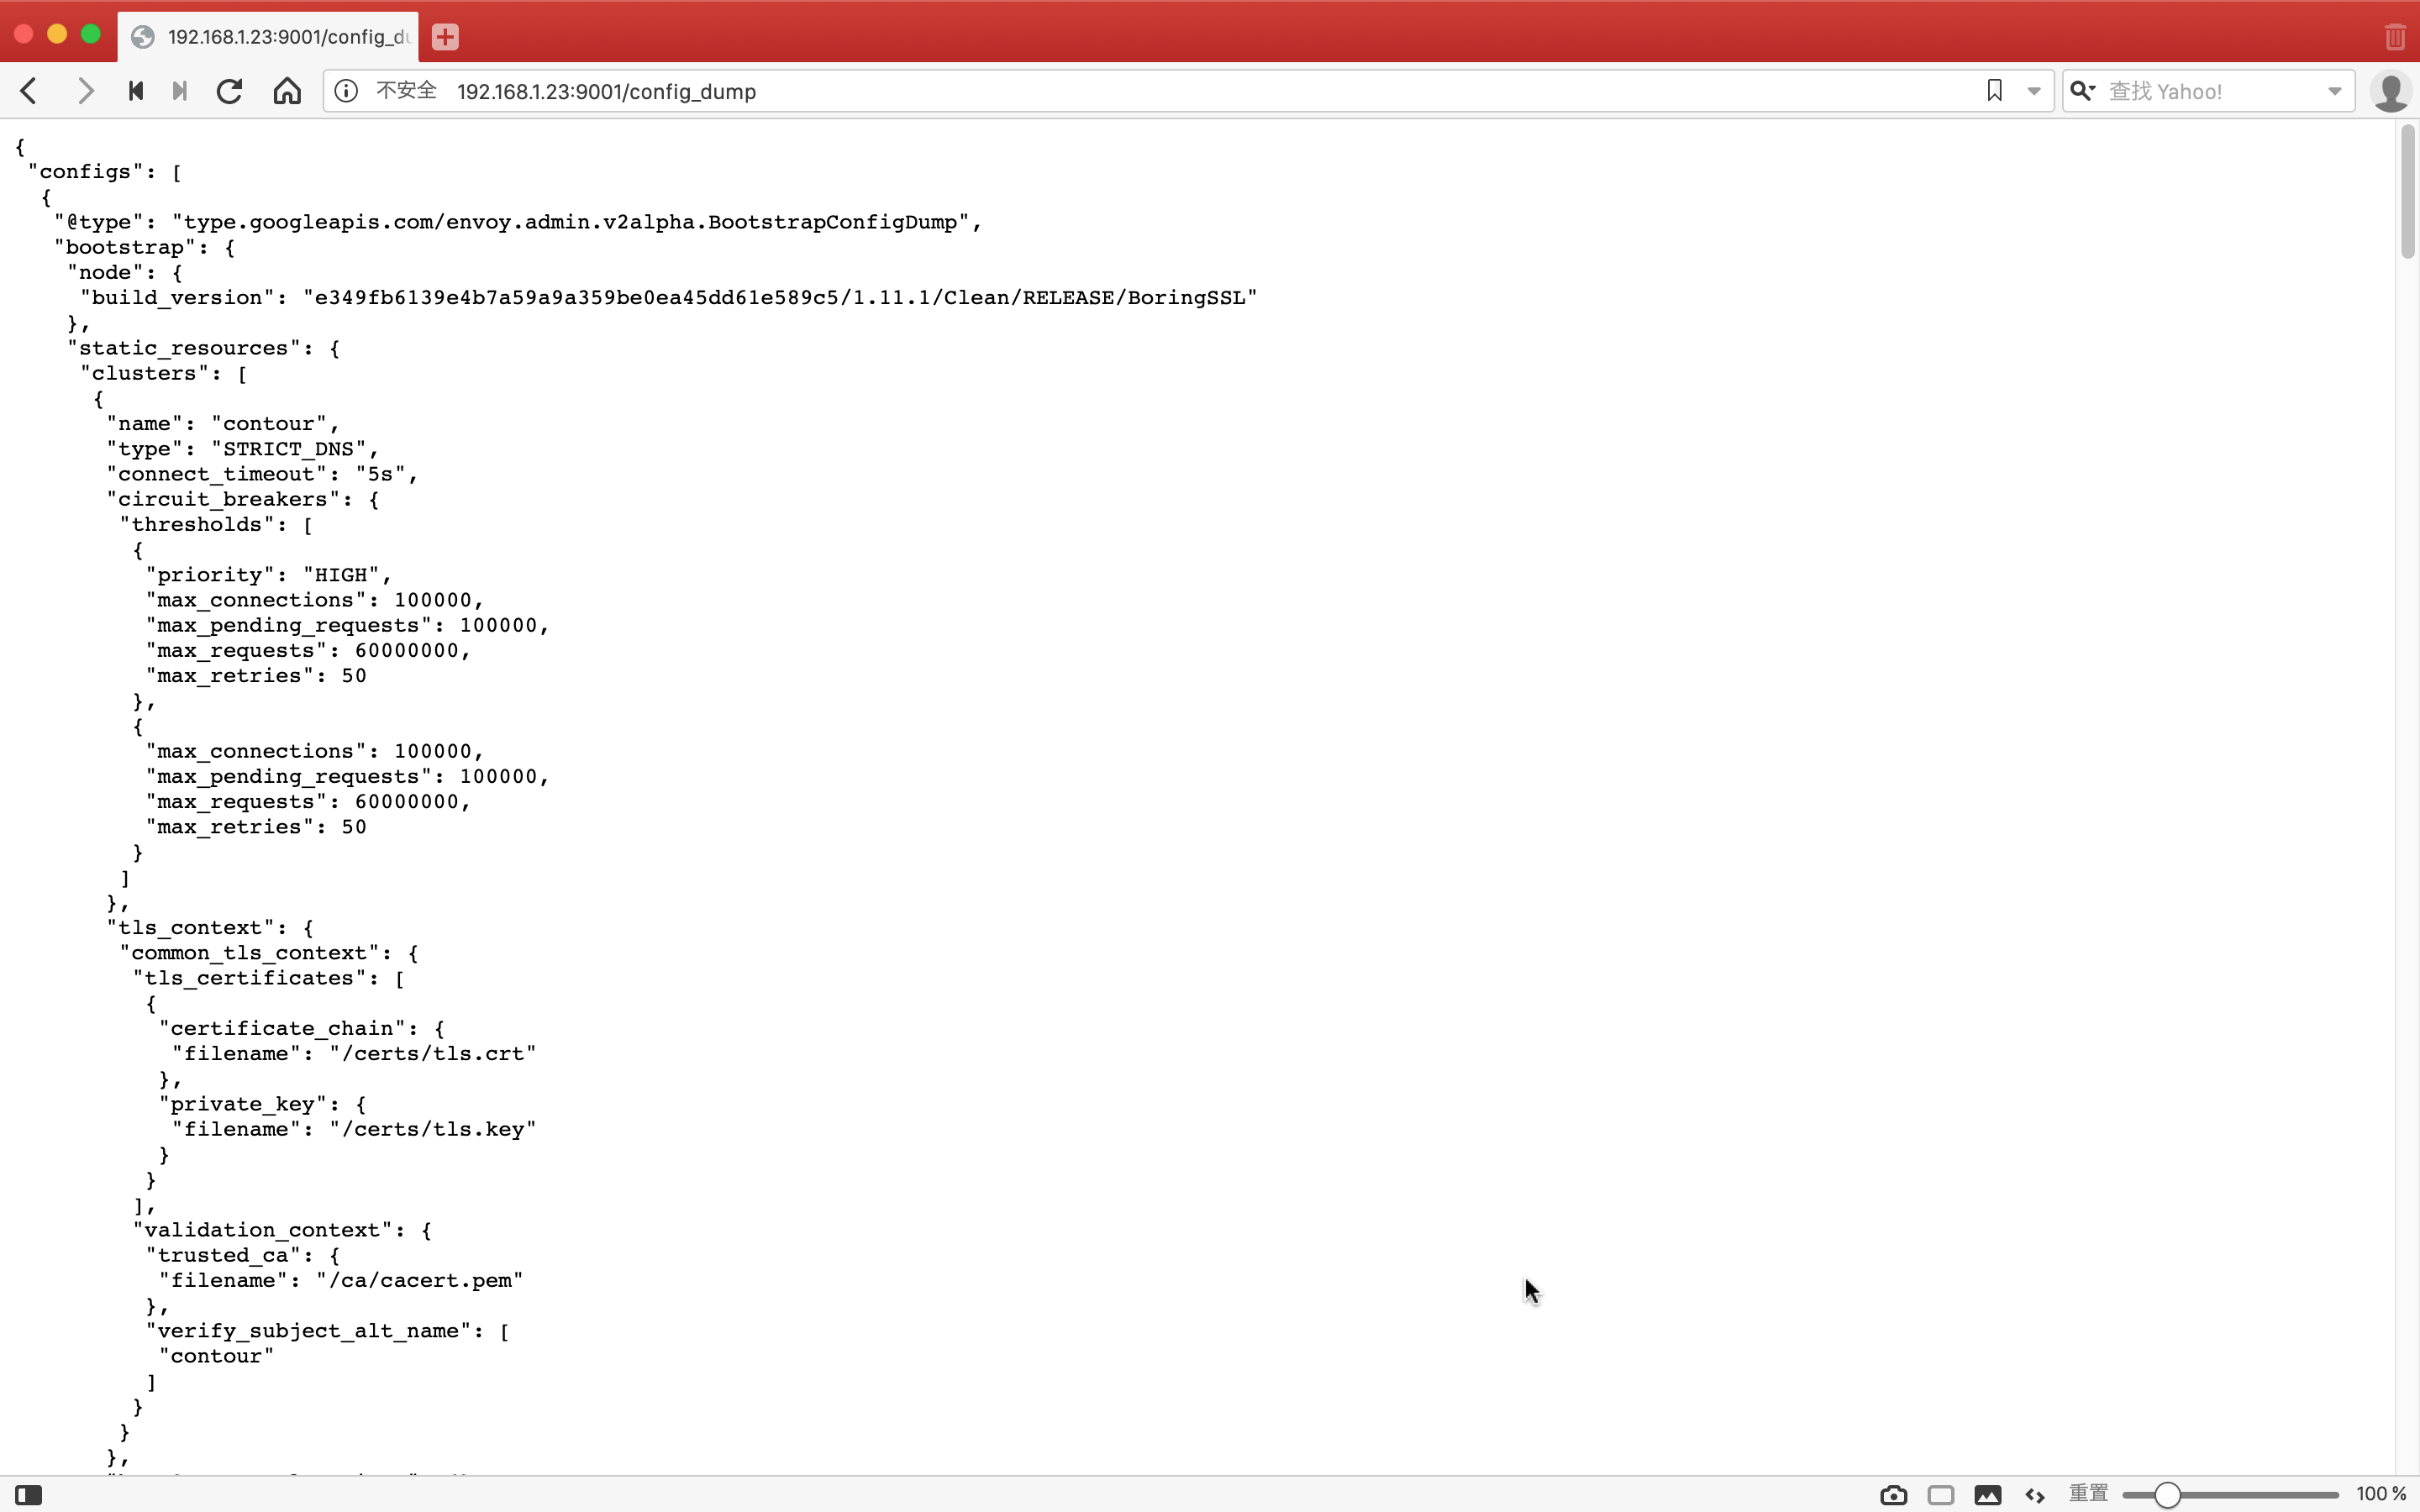
我们在第二节创建了一个 ingressroute,现在来看看它是怎么映射到 Envoy 的配置文件中的。你可以到 config_dump 中查找相关配置,但还有更好的办法,我们可以通过 Contour 的命令行工具直接调用 Contour 的 xDS gRPC 接口来分别查看 Envoy 的 Listener、Route、Cluster 和 Endpoint 配置。
Contour 总共有两个实例,通过选举来实现高可用,被选中的实例作为 leader 来对外提供服务。
$ kubectl -n heptio-contour get pod -l app=contour

NAME                       READY   STATUS    RESTARTS   AGE
contour-767fd99989-27qjw   1/1     Running   0          14h
contour-767fd99989-kcjxz   0/1     Running   0          14h
看看哪个是 leader:

可以看到该实例不是 leader,我们到另一个实例中去查看 Envoy xDS 配置。
Listener#
Envoy 采用 listener 来接收并处理 downstream 发过来的请求,listener 的处理逻辑是插件式的,可以通过配置不同的 filter 来插入不同的处理逻辑。Listener 可以绑定到 IP Socket 或者 Unix Domain Socket 上,也可以不绑定到一个具体的端口上,而是接收从其他 listener 转发来的数据。
Listener 的配置可以通过下面的命令查看:
$ kubectl -n heptio-contour exec -it contour-767fd99989-27qjw -- contour cli --cafile=/ca/cacert.pem --cert-file=/certs/tls.crt --key-file=/certs/tls.key lds

可以看到 Listener 被绑定到了 80 端口上,同时通过 RDS 配置了一个路由规则 ingress_http,在路由规则中再根据不同的请求目的地对请求进行处理。
Route#
Route 用来配置 Envoy 的路由规则,根据 host 来对请求进行路由分发。
Route 的配置可以通过下面的命令查看:
$ kubectl -n heptio-contour exec -it contour-767fd99989-27qjw -- contour cli --cafile=/ca/cacert.pem --cert-file=/certs/tls.crt --key-file=/certs/tls.key rds

上面是 ingress_http 的路由配置,对应了两个 virtual host,其中一个是默认路由(图中省略),上面展示的是 kuard 的路由,对应到 Cluster default/kuard/80/da39a3ee5e。其中 domains: "kuard.local:*" 表示允许访问的域名为 kuard.local,端口可以是任意值。
Cluster#
Cluster 是一个服务集群,Cluster 中包含一个到多个 endpoint,每个 endpoint 都可以提供服务,Envoy 根据负载均衡算法将请求发送到这些 endpoint 中。
Cluster 的配置可以通过下面的命令查看:
$ kubectl -n heptio-contour exec -it contour-767fd99989-27qjw -- contour cli --cafile=/ca/cacert.pem --cert-file=/certs/tls.crt --key-file=/certs/tls.key cds

cluster_name: "contour" 表示通过 xDS 接口从 contour 控制平面动态获取 Endpoint 信息。获取到的 Endpoint 是 default/kuard。
Endpoint#
Endpoint 就对应到 Kubernetes 中的 Endpoint 资源,对应的即是 Pod 的 IP+Port。
Cluster 的配置可以通过下面的命令查看:
$ kubectl -n heptio-contour exec -it contour-767fd99989-27qjw -- contour cli --cafile=/ca/cacert.pem --cert-file=/certs/tls.crt --key-file=/certs/tls.key eds|grep "default/kuard" -A 34 -B 2
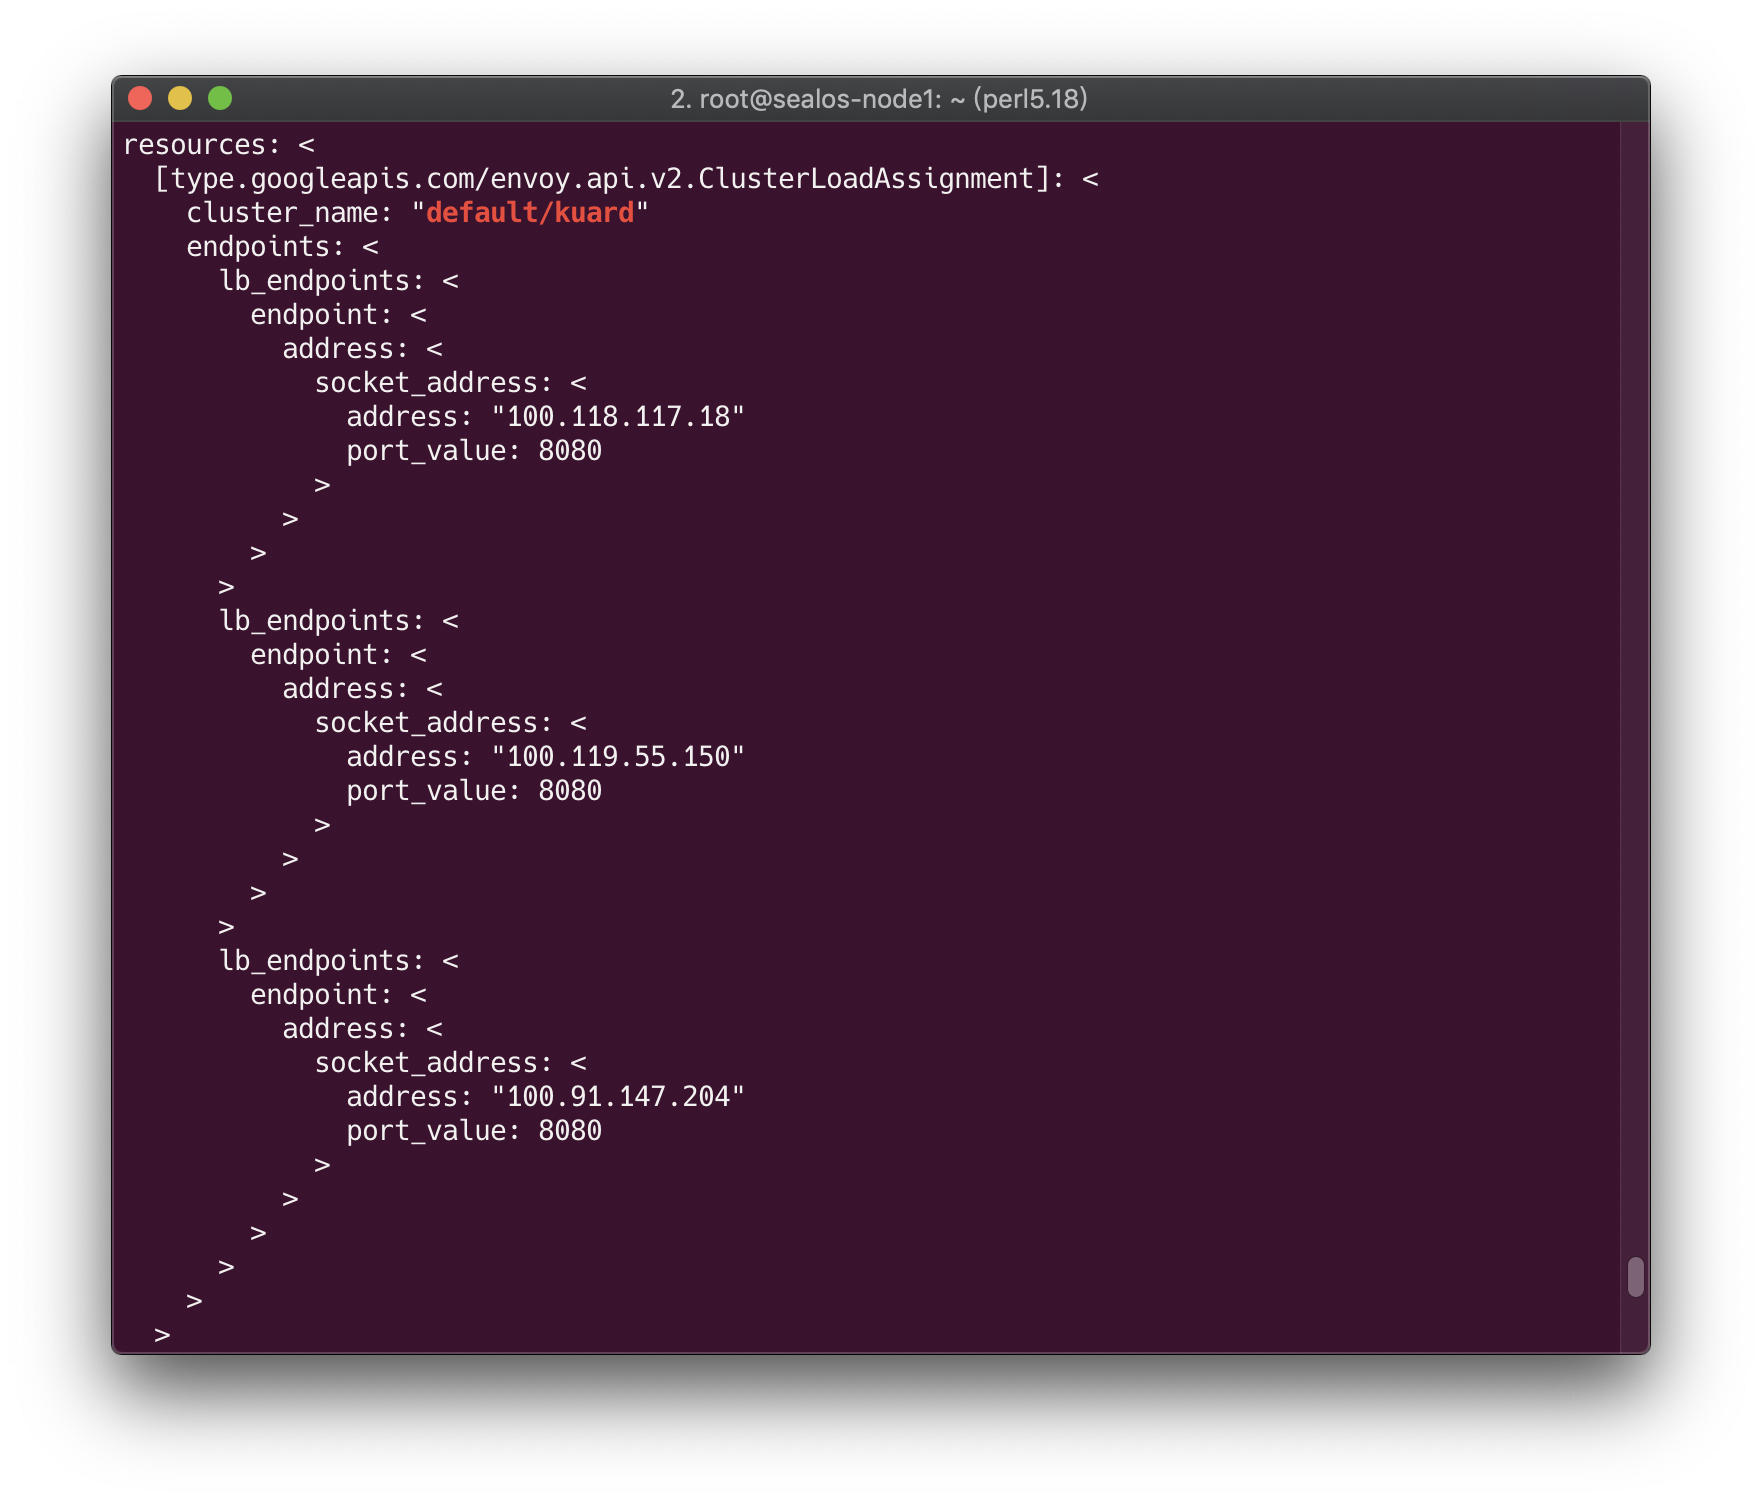
验证一下:
$ kubectl get ep -l app=kuard

NAME    ENDPOINTS                                                     AGE
kuard   100.118.117.18:8080,100.119.55.150:8080,100.91.147.204:8080   17h
对接监控#
Contour 和 Envoy 都暴露一些监控指标可以被 Prometheus 抓取,官方也提供了 Prometheus 和 Grafana 的部署模板,但一般情况下我们都会有自己的监控系统,比如 prometheus-operator,只需要将官方的 Grafana 模板导入自己的 Grafana 中就可以了,后续会探讨详细步骤。
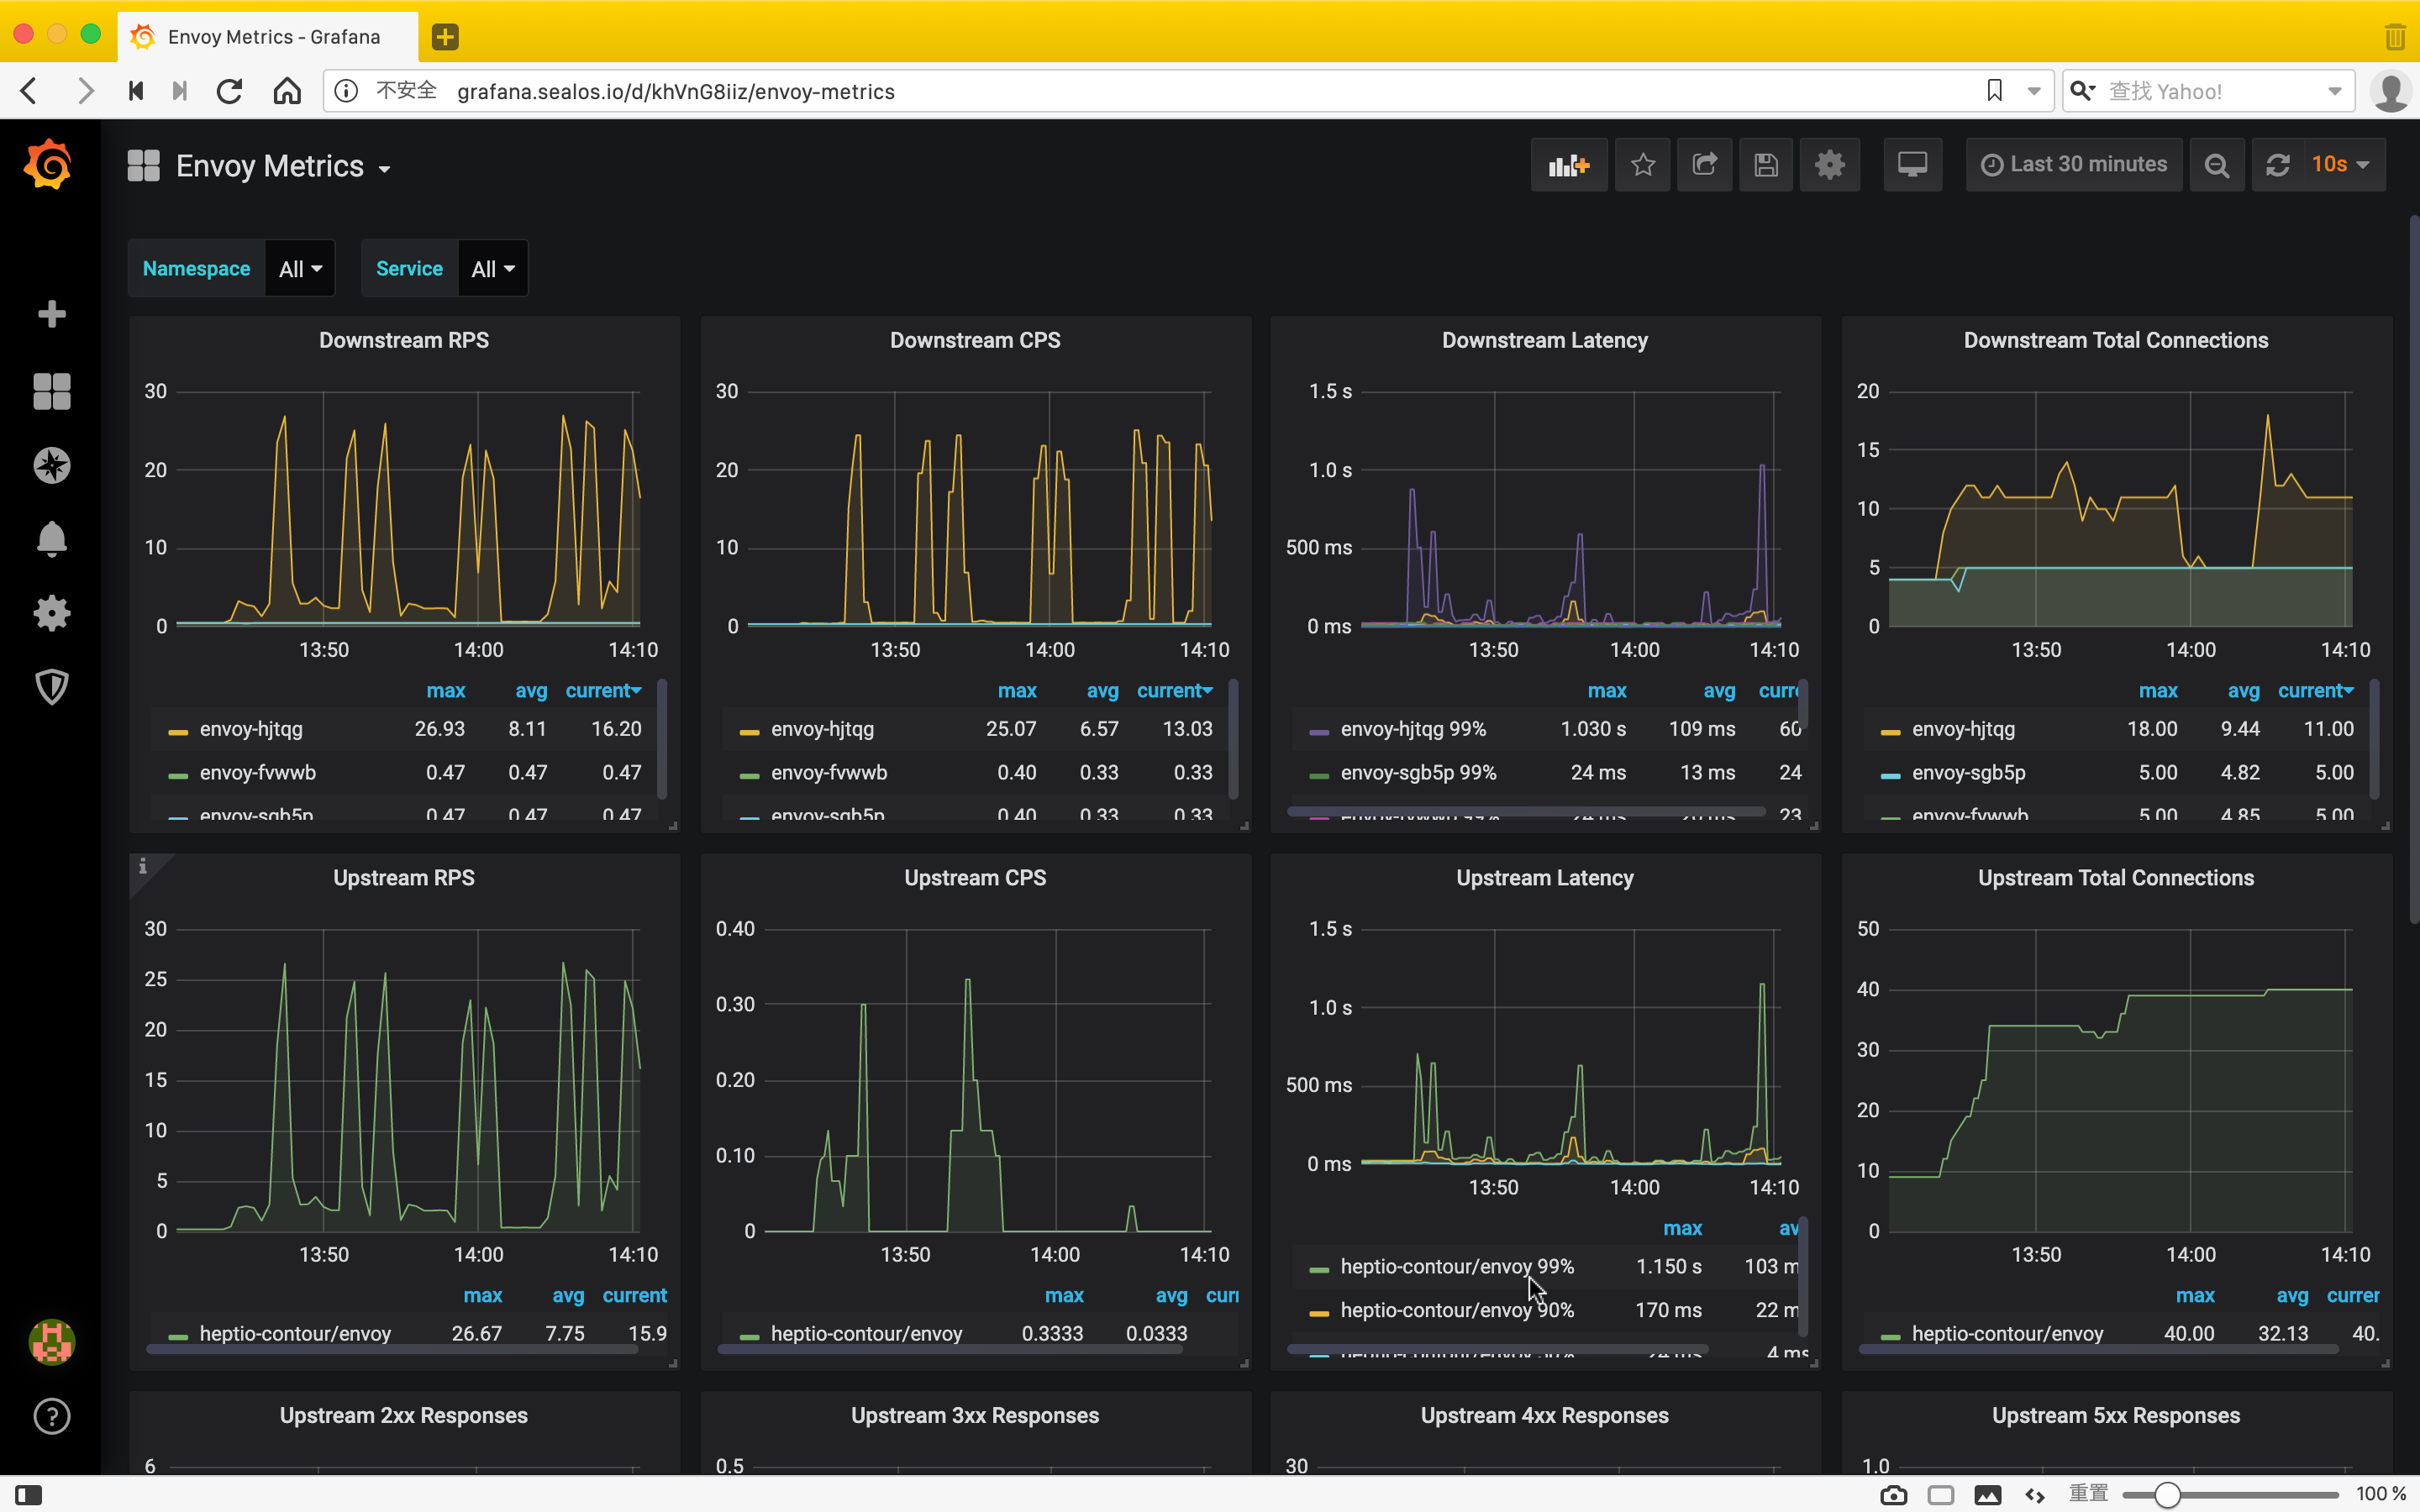
Envoy Metrics#
Envoy 默认通过 admin 接口暴露监控指标,为了避免暴露 admin 接口,Contour 创建了一个静态 Listener,只将访问路径为 /stats 的流量转发到 service-stats Cluster,即 admin 接口,其他所有请求一律拒绝访问。


本文只是为了方便查看,才将 admin 接口的 IP 改为 0.0.0.0,生产环境建议不要改,默认值为
127.0.0.1。
所以 Envoy 在 8002 端口暴露监控指标,路径为 /stats/prometheus。
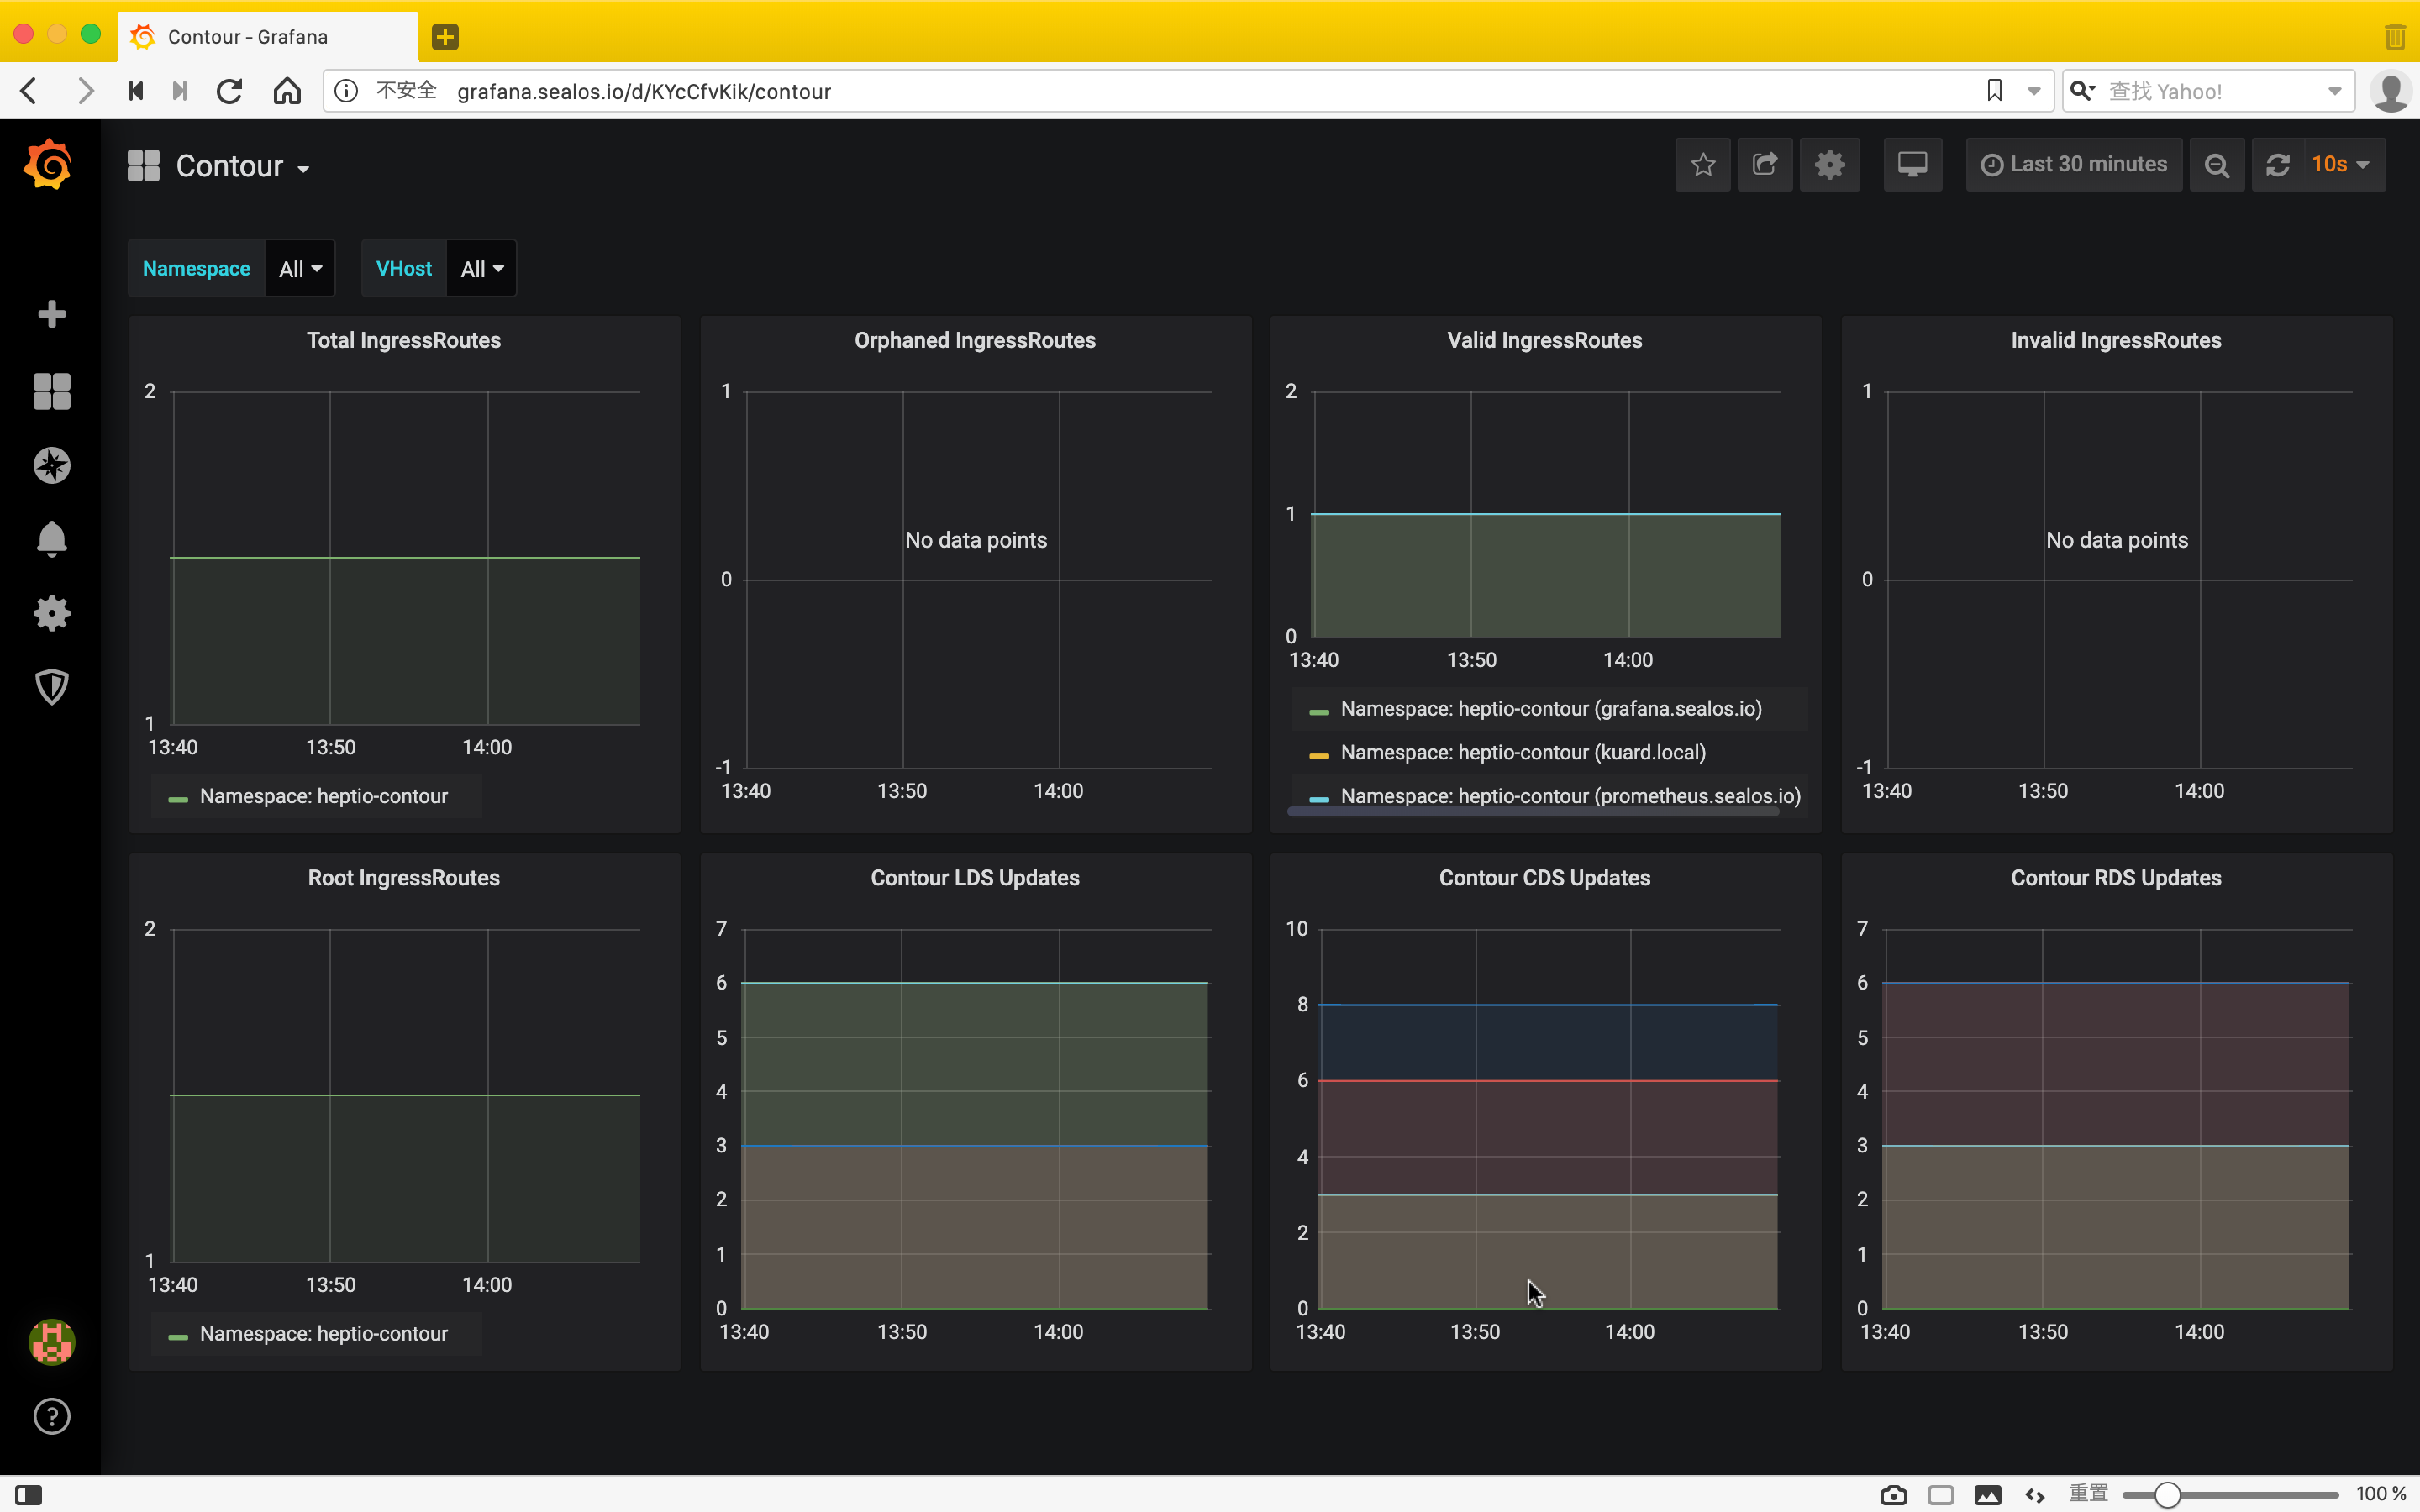
Contour Metrics#
Contour 在 8000 端口上暴露监控指标,路径为 /metrics。包含以下监控指标:
- contour_ingressroute_total (gauge) : IngressRoute 的总数量,包括状态为
Valid / Invalid / Orphaned的 IngressRoute。 - contour_ingressroute_orphaned_total (gauge) : 状态为
Orphaned的 IngressRoute 数量。 - contour_ingressroute_root_total (gauge) :
RootIngressRoute 的数量(每个 vhost 只有一个 Root IngressRoute)。 - contour_ingressroute_valid_total (gauge) : 状态为
Valid的 IngressRoute 数量。 - contour_ingressroute_invalid_total (gauge) : 状态为
Invalid的 IngressRoute 数量。 - contour_ingressroute_dagrebuild_timestamp (gauge) : 最近一次重建 DAG 的时间戳。
下面就来教大家怎么将 Contour 接入 Prometheus-Operator,对 Prometheus-Operator 不熟的同学,推荐看一下张馆长的这篇文章:全手动部署prometheus-operator监控Kubernetes集群遇到的坑。
RBAC 授权#
为了让 Prometheus 能够 list 其他 namespace 中的 pod,我们需要赋予它相应的权限,首先进入 kube-prometheus 项目的 manifests 目录:
$ cd kube-prometheus/manifests

$ ll *SpecificNamespace*
4 -rw-r--r-- 1 root root  988 8月  27 05:22 prometheus-roleBindingSpecificNamespaces.yaml
4 -rw-r--r-- 1 root root 1078 8月  27 05:15 prometheus-roleSpecificNamespaces.yaml
修改 prometheus-roleSpecificNamespaces.yaml,向其中添加如下的 Role:
- apiVersion: rbac.authorization.k8s.io/v1
  kind: Role
  metadata:
    name: prometheus-k8s
    namespace: heptio-contour
  rules:
  - apiGroups:
    - ""
    resources:
    - services
    - endpoints
    - pods
    verbs:
    - get
    - list
    - watch
修改 prometheus-roleBindingSpecificNamespaces.yaml,向其中添加如下的 RoleBinding:
- apiVersion: rbac.authorization.k8s.io/v1
  kind: RoleBinding
  metadata:
    name: prometheus-k8s
    namespace: heptio-contour
  roleRef:
    apiGroup: rbac.authorization.k8s.io
    kind: Role
    name: prometheus-k8s
  subjects:
  - kind: ServiceAccount
    name: prometheus-k8s
    namespace: monitoring
然后创建相应的 Role 和 RoleBinding:
$ kubectl apply -f prometheus-roleSpecificNamespaces.yaml
$ kubectl apply -f prometheus-roleBindingSpecificNamespaces.yaml
修改 Contour manifest 文件#
Prometheus 监控的对象被叫做 Target,Target 通过 Cluster 中的 Endpoint 资源来定义,每个监控对象都有一个对应的 Endpoint。而 ServiceMonitor 是 Target 的抽象,ServiceMonitor 通过标签来找到对应的 Endpoint,然后将相应的 Target 添加到 Prometheus 的监控列表中。
默认情况下 Contour 的 Service 是没有打标签的,所以我们需要修改 yaml 文件,加上相应的标签。首先修改 Contour Deployment 的 yaml 文件:
# 03-contour.yaml
ports:
- containerPort: 8001
  name: xds
  protocol: TCP
- containerPort: 8000
  name: http-metrics # 将 name 改为 http-metrics
  protocol: TCP
再修改 Contour Service 的 yaml 文件:
# 02-service-envoy.yaml
ports:
- port: 80
  name: http
  protocol: TCP
- port: 443
  name: https
  protocol: TCP
# 添加新端口
- port: 8002
  name: http-metrics
  protocol: TCP
Envoy 类似,先修改 Envoy Deployment 的 yaml 文件:
# 03-envoy.yaml
ports:
- containerPort: 80
  hostPort: 80
  name: http
  protocol: TCP
- containerPort: 443
  hostPort: 443
  name: https
  protocol: TCP
# 添加新端口
- containerPort: 8002
  hostPort: 8002
  name: http-metrics
  protocol: TCP
再修改 Envoy Service 的 yaml 文件:
# 02-service-envoy.yaml
ports:
- port: 80
  name: http
  protocol: TCP
- port: 443
  name: https
  protocol: TCP
# 添加新端口
- port: 8002
  name: http-metrics
  protocol: TCP
最后重新 apply 一下:
# 在 contour/examples/ds-hostnet-split 目录下
$ kubectl apply -f ./
创建 ServiceMonitor#
接下来就是创建相应的 ServiceMonitor 来抓取指标数据,没什么好说的,自己看 yaml 文件:
$ cat prometheus-serviceMonitorContour.yaml

apiVersion: monitoring.coreos.com/v1
kind: ServiceMonitor
metadata:
  labels:
    app: contour
  name: contour
  namespace: monitoring
spec:
  endpoints:
  - interval: 30s
    port: http-metrics
  jobLabel: app
  namespaceSelector:
    matchNames:
    - heptio-contour
  selector:
    matchLabels:
      app: contour
---
apiVersion: monitoring.coreos.com/v1
kind: ServiceMonitor
metadata:
  labels:
    app: envoy
  name: envoy
  namespace: monitoring
spec:
  endpoints:
  - interval: 30s
    path: /stats/prometheus
    port: http-metrics
  namespaceSelector:
    matchNames:
    - heptio-contour
  selector:
    matchLabels:
      app: envoy
创建 IngressRoute#
为了查看 Prometheus 和 Grafana 的 Dashboard,我们需要为它们创建相应的 IngressRoute,yaml 文件内容如下:
# ingressroute-prometheus.yaml
apiVersion: contour.heptio.com/v1beta1
kind: IngressRoute
metadata:
  labels:
    app: grafana
  name: grafana
  namespace: monitoring
spec:
  virtualhost:
    fqdn: grafana.sealos.io
  routes:
    - match: /
      services:
        - name: grafana
          port: 3000
---
apiVersion: contour.heptio.com/v1beta1
kind: IngressRoute
metadata:
  labels:
    app: prometheus
  name: prometheus
  namespace: monitoring
spec:
  virtualhost:
    fqdn: prometheus.sealos.io
  routes:
    - match: /
      services:
        - name: prometheus-k8s
          port: 9090
直接 apply:
$ kubectl apply -f ingressroute-prometheus.yaml
将域名写入本地电脑的 hosts 中:
$ echo "$INGRESS_HOST grafana.sealos.io" >> /etc/hosts
$ echo "$INGRESS_HOST prometheus.sealos.io" >> /etc/hosts
其中 $INGRESS_HOST 是任意运行 Envoy 节点的 IP。
现在我们可以在浏览器中输入域名 prometheus.sealos.io 来查看 Prometheus Target 状态。

可以看到这两个 Target 已经被抓取到了。
导入 Grafana 模板#
前面提到 Contour 官方仓库中提供了 Grafana Dashboard 模板,现在我们要做的事就是把这个模板导入到自己的 Grafana 中。官方的 Grafana Dashboard 模板定义在 contour/examples/grafana 目录下的 ConfigMap 文件中,可以先把它导出来:
# 假设 contour 项目在你的 $HOME 目录
$ sed '/---/,$d' ~/contour/examples/grafana/02-grafana-configmap.yaml \
  |sed 's/grafana-dashs/grafana-dashboard-contour/' \
  |sed 's/contour-monitoring/monitoring/' \
  |sed 's/kubernetes_pod_name/pod/g' \
  |sed 's/ingress_http_update/update/g' \
  |kubectl apply -f -

configmap/grafana-dashboard-contour created
创建了 ConfigMap 后,还要再挂载到 Grafana 的 Dashboard 中,所以需要修改 Grafana Deployment 的 yaml 文件:
# ~/kube-prometheus/manifests/grafana-deployment.yaml
        volumeMounts:
        - mountPath: /var/lib/grafana
          name: grafana-storage
          readOnly: false
        ...省略...
        # 新增挂载
        - mountPath: /grafana-dashboard-definitions/0/contour
          name: grafana-dashboard-contour
          readOnly: false
        ...省略...
      volumes:
      - emptyDir: {}
        name: grafana-storage
      ...省略...
      # 新增 ConfigMap
      - configMap:
          name: grafana-dashboard-contour
        name: grafana-dashboard-contour
重新 apply 一下:
$ kubectl apply -f grafana-deployment.yaml
现在在浏览器中输入域名 grafana.sealos.io,就可以看到 Contour 和 Envoy 的 Dashboard 了。
对接监控到这里就结束了,剩下的大家可以自己去探索,总体来说难度还是稍微有点大,希望我的细心讲解能够帮助到你。